Exploring Power Platform and Beyond: Features, Experiences, Challenges, Solutions all in one place
Author: Pavan Mani Deep Y
Passionate for Power Platform. A technology geek who loves sharing the leanings, quick tips and new features on Dynamics 365 & related tools, technologies. An Azure IOT and Quantum Computing enthusiast...
By this time, almost every Dynamics 365 Developer had some day or the other used Level up in their Custom Engagement consultant career.
While every one out in the Dynamics CRM Space know about the widely popular God mode available in Level Up which helps in the day to day administration and maintenance activity of CE applications.
Today in this blog post, lets see how we can achieve impersonation using Level up. We all know about impersonation in Dynamics CRM possibly using Plugins via Plugin Registration tool or directly through code.
But do you know, using Level Up, do you know that you even don’t need to write any piece of code but can impersonate to any user in the system with thin a few clicks right from your browser. If this interests you, just follow along…
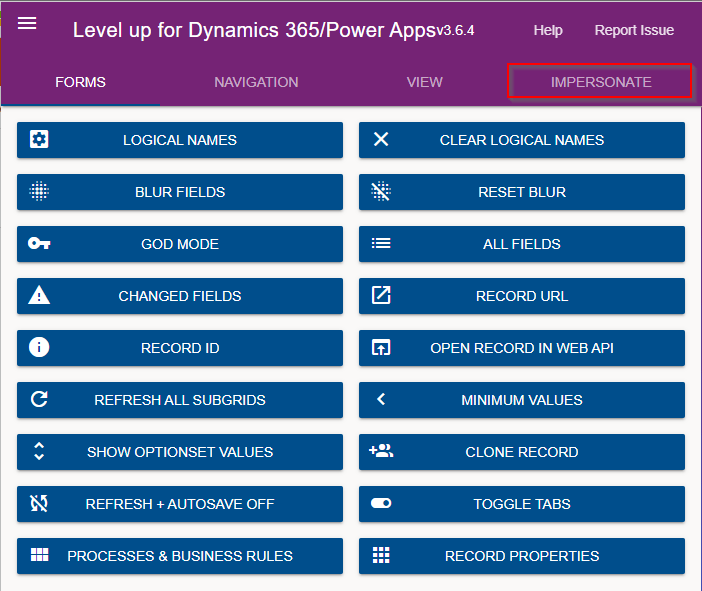
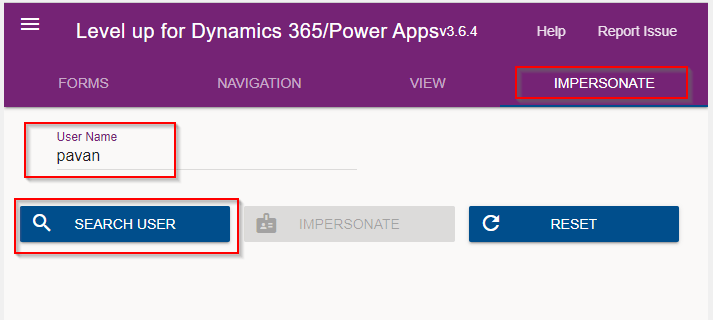
Just open the level up chrome extension. This is how your home screen look like once opened..to use this feature, just click on Impersonate as highlighted in the below image. For all this activity, I am logged in as Admin user to the system.
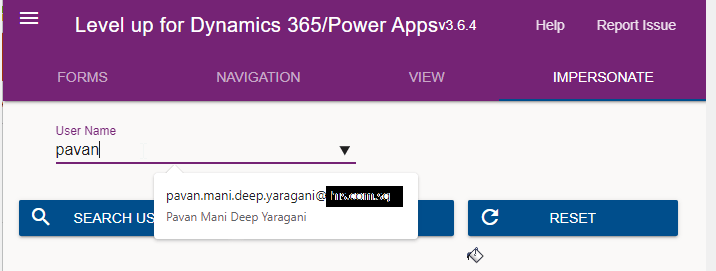
Next you can search with the username with whom you want to impersonate with i.e. here I would like to impersonate with my user account. You can search and impersonate with any user in the system.
Once you click on SEARCH USER
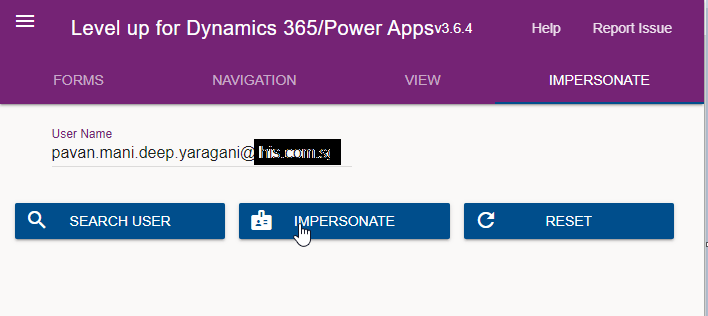
Upnext, click on impersonate button available as below
It opens a new window impersonated with the user account as the user choosen for the impersonation.
The screen shows as the user pavan is the logged in user…
Now you can perform all the operations same as what user pavan has…how cool is it…this feature perfects suits when you want to test out the application security roles where you would like to make a change to a user role and assign to other team member, test it without needing his/her presence. Cool to know, isn’t it….
References:
You can install the extension on Edge, Firefox and Chrome.
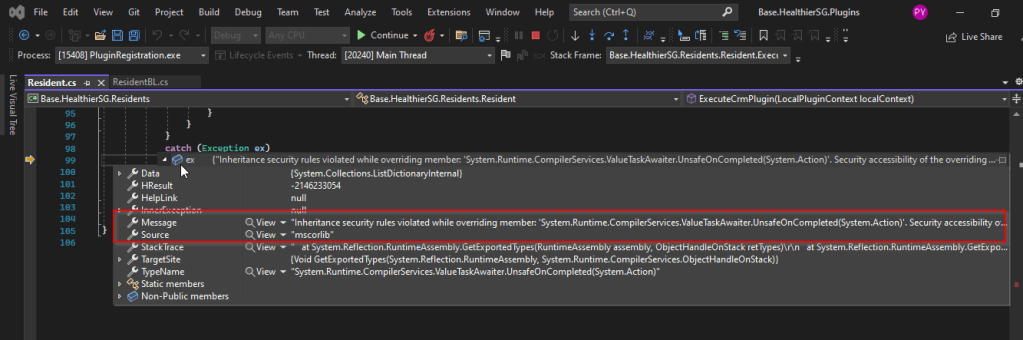
I recently came across the above error for one of my Dynamics 365 Plugins…this blog talks about applying a quick fix.
While debugging our Plugin logic line by line to understand why it’s not working, observed this error for messages like RetrieveMultiple, Retrieve when I use any Organization Service call.
This was a .Net version downgrade issue caused by ILMerge as I downgraded one of the DLL to 4.6.2 version from 4.7.1. If you see this issue even without downgrading your DLL, you can use this fix.
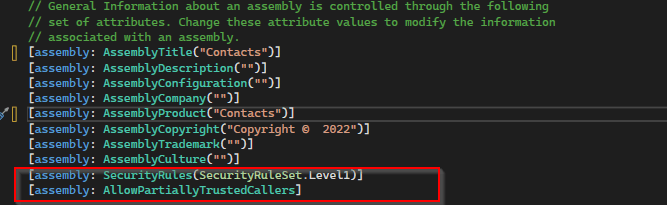
After some research I came across this article and applied the same to my assembly which fixed the issue. Added these lines to my AssemblyInfo.cs class file..
Have you or some one in your team accidentally deleted some your flows and want them to be back..? Then this post is for you…
There are the two ways you can restore deleted flows up to 20 days in either way…once after 20 days, even Microsoft Support couldn’t recover your flows.
In this blog post, we will see how you can recover your flows using first approach using Power Automate Management connector which is much simpler.
All you need is a button flow with two Power Automate management connector actions—List Flows as Admin and Restore Deleted Flows as Admin.
So let’s see…
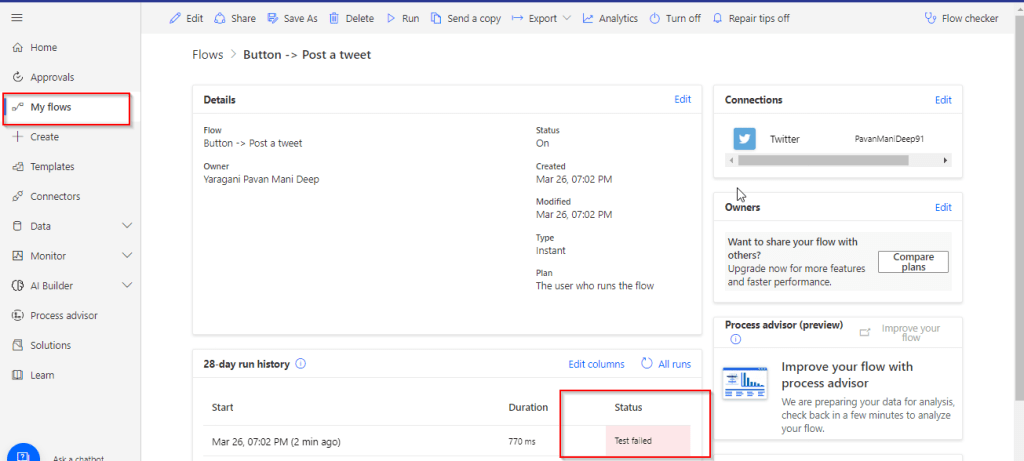
I have a very simple flow as below…
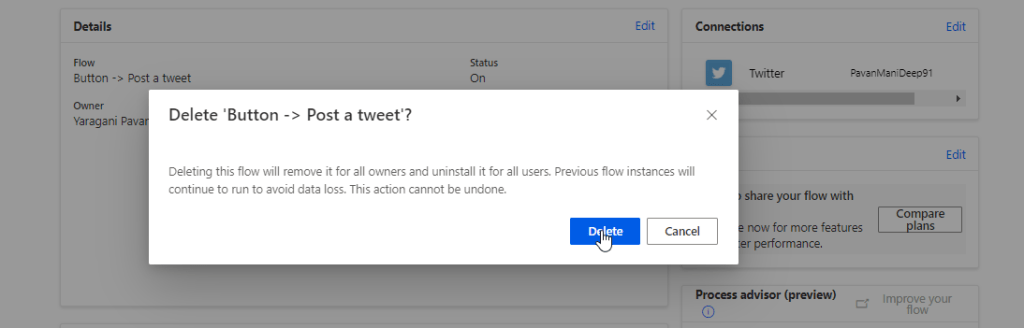
But is has been failing due to some authentication issue, so I have deleted it…
Later I understood the root cause for the authentication issue, I want the flow created to be back. But no problem, you can recover your flow as below…So follow these steps to quickly get your deleted flow back…using an another flow…
Choose a manual trigger…
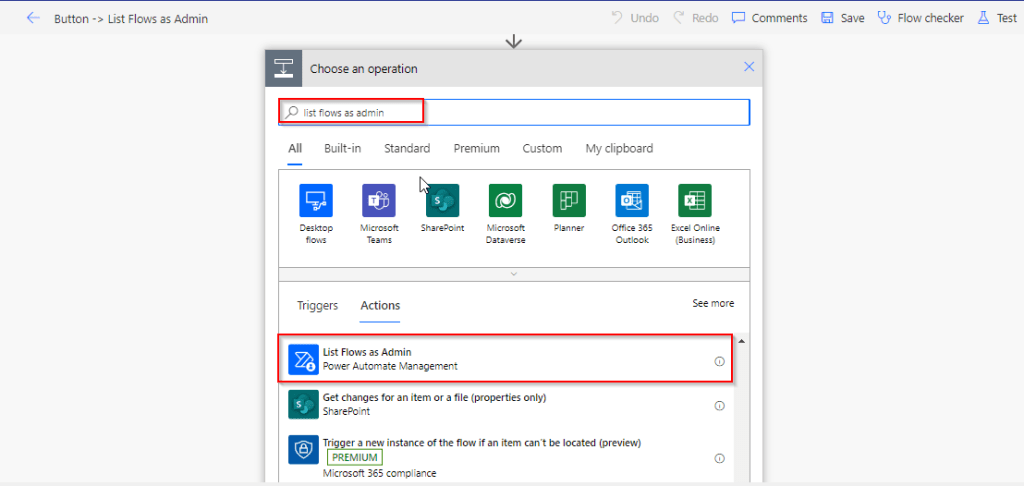
Next add an action, and choose an operation by searching list flows as admin.
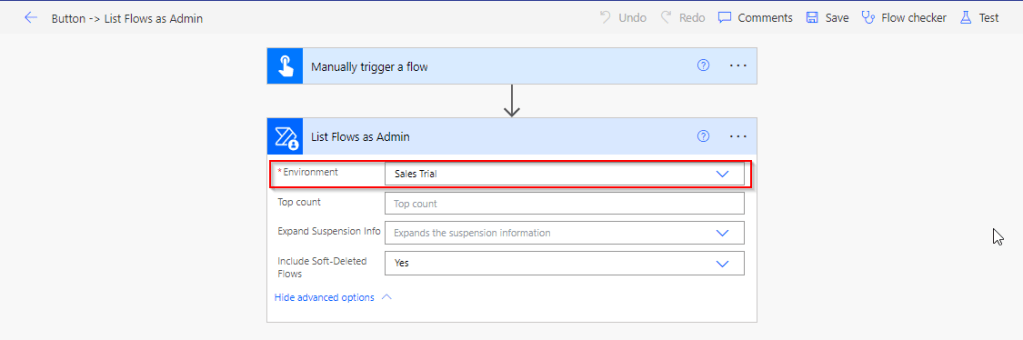
Select your environment in the connector
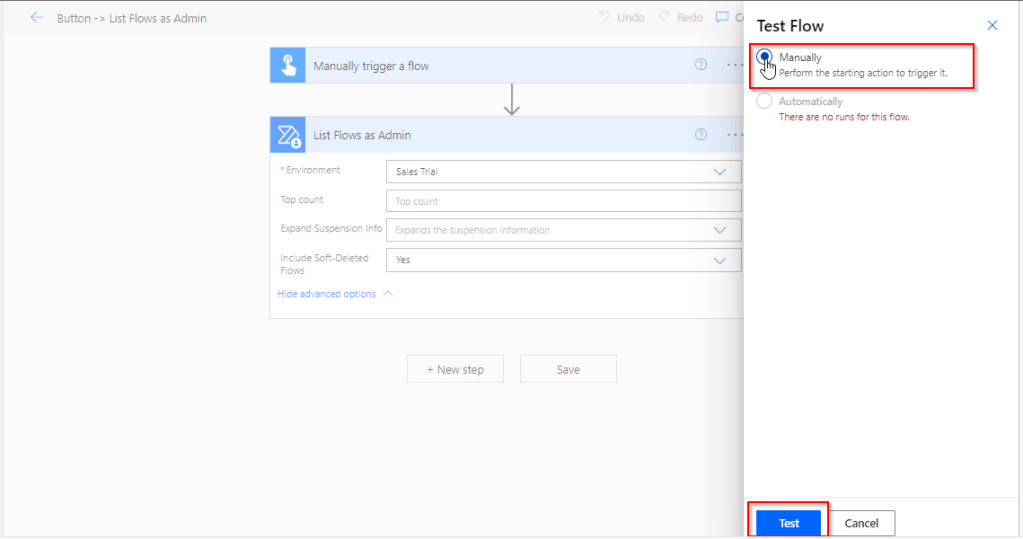
Save your flow and test it…
Once your flow is successful, verify the outputs..scroll to find out the flow, check for the display name and note down the name associated.
This connector will list down all the flows created in your tenant…when you expand the raw OUTPUTS/value. Note the name which is nothing but the Guid of your flow.
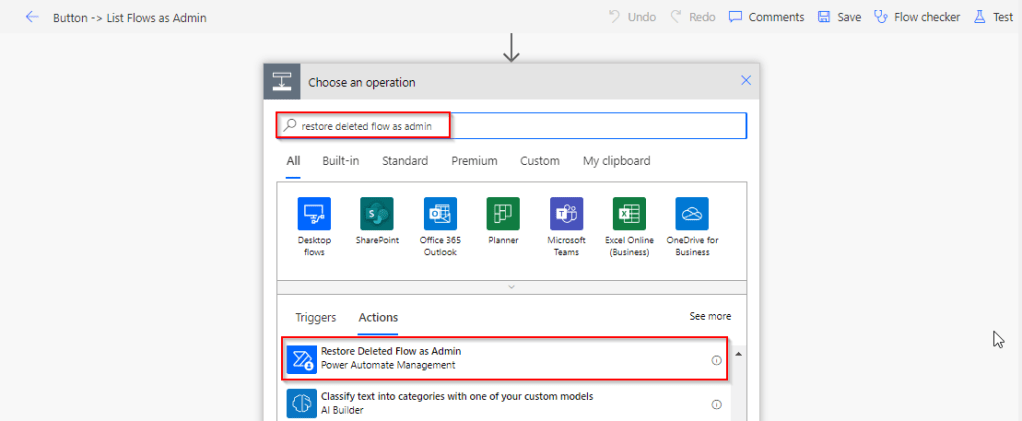
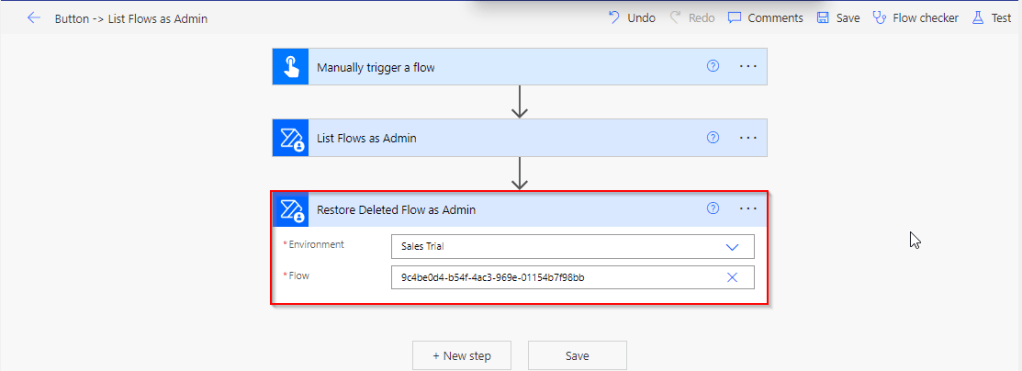
Add Restore Deleted Flows as Admin action and run the flow by searching for the same as below.
Add the Restore Deleted Flows as Admin action from the Power Automate Management Connector.
In the Flow field, enter the name value ie. Guid noted from previous step ie.
9c4be0d4-b54f-4ac3-969e-01154b7f98bb
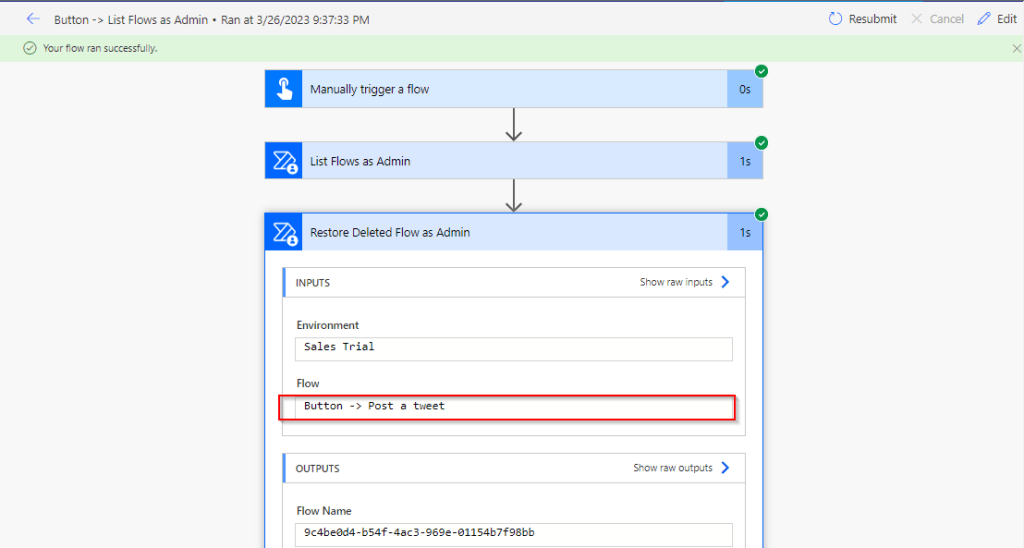
Save the flow, and test/run it.
You can note your flow is back, you can find out under My Flows but it’s disabled state.
Note:
The steps in this article apply to both non-solution and solution flows.
Flows that were deleted more than 20 days ago can’t be recovered. Both restore methods (PowerShell script and Power Automate Management connector), as well as Microsoft Support can’t help to restore them.
After you restore a flow, it defaults to the disabled state. You must manually enable the flow, per your requirements.
As you all know Application Life Cycle Management(ALM) is very important for a project to become successful in this automation era. The faster is the iteration speed to deploy your solution to production, the more healthy your project is and so your stakeholders. This kind of Automation is usually made possible with the help of CI/CD Azure Pipelines. CI/CD for GIT Repo for Azure DevOps is famous from quite some time. You might have heard that Microsoft had got this kind of CI/CD architecture to Power Platform released in Preview last year and is now Generally Available(GA).
But if you still don’t really have a hands on and pretty new to get this into your project, then this blog post is for you. You don’t need to know Azure DevOps or at least you don’t need to be technical to use this new capability, even administrators can. All you need is to just follow along….You can download the presenation I had presented at Singapore User Group here…
First of all, let’s see what are the prerequisites to create a Power Platform Pipeline.
Four environments are recommended, but you can use as few as three environments to create a pipeline.
Dataverse database is a must in all the environments except the Host Environment.
Dataverse for Teams environments aren’t supported for use with pipelines.
You must have a Power Platform administrator or system administrator role.
Pipelines are a feature of Managed Environments. As such, the development and target environments used in a pipeline must be enabled as a managed environment. Standalone licenses won’t be required when you use developer or trial environments with pipelines. More information: Managed Environments.
If you want to share these pipelines, you should grant access by opening the security from the host environment. The Deployment Pipeline User security role grants access to run one or more pipelines.
Now let’s see how you can set up Power Pipelines…
You need to identify which of your environments you want to configure pipeline for. For a healthy pipeline, at least you need 3 environments ie. Dev, Test, Prod, however there is no upper cap.
So for configuring our pipeline, we need one more environment in addition to above which is nothing but Host Environment which serves as the environment which stores all the configuration of the pipeline.
So below are our environments we will be using in this tutorial…
First thing, you have to do is to set up the host environment which holds the configuration of your pipeline. The configuration is pretty much easy and intuitive to follow. Make sure you choose same region to all your environments and select type as Production for all environments except developer environment. You don’t actually need to create a database as this stores only the configuration.
In the same way, I have already created the host environment and I also have few trials which I will be one of them as my test environment and one as my Developer environment, we can also configure other environment but for brevity I am leaving one not configured. Make sure to check Create database for this environment while you were creating for all the environments except the Host Environment.
For setting up the pipeline, you need to have the Environment Id’s of the environments which you would like to configure ready. Follow this link if you don’t know how you can get them.
Copy and paste them in a notepad for your quick reference during configuration.
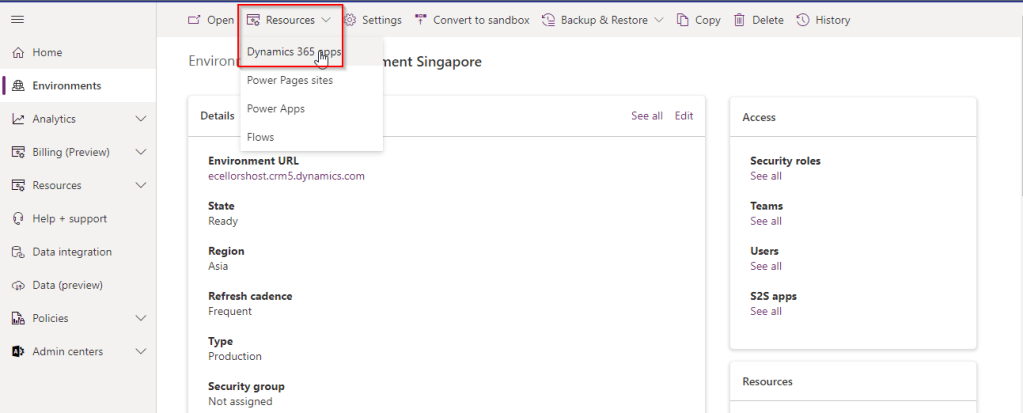
Open the host environment from Admin portal and click on Resources Option available and click on Dynamics 365 apps.
In the next window, click on Install app and in the list of apps, choose Power Platform Pipelines, click on Next and install the app after agreeing the terms of service.
Now you need to open the host environment from https://make.powerapps.com to configure the pipeline and you should an app for Deployment Pipeline Configuration as below.
Before moving further let’s understand the table structure used for the pipeline.
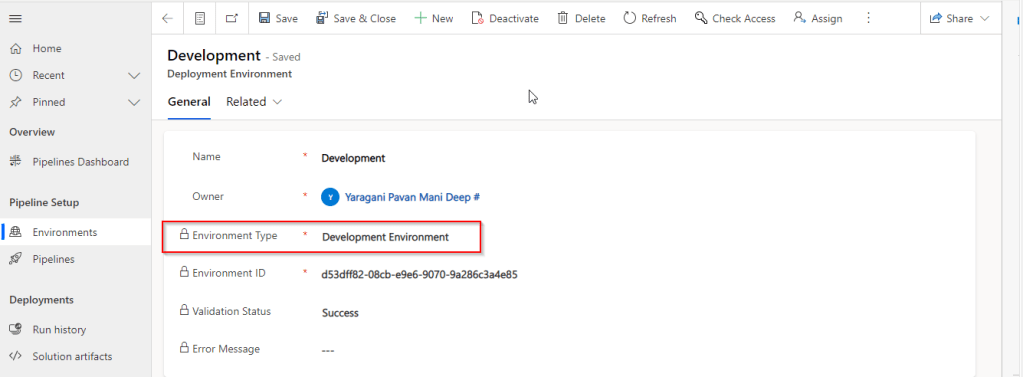
Open this app as below and configure the environments which you want to use in your pipeline, set up the Development environment from where you would like to deploy the changes to your target. Make sure you select Environment Type as Development Environment and provide the respect Environment Id which you copied to your notepad earlier as above.
Similarly configure the other target environments, but proceed to select as Target Environment as the environment type. Once after system validation is done, validation status is shown as successful and the environments setup will look as below.
Now you need to create a pipeline for the configured environments, once saved, link the development environment which you configured above.
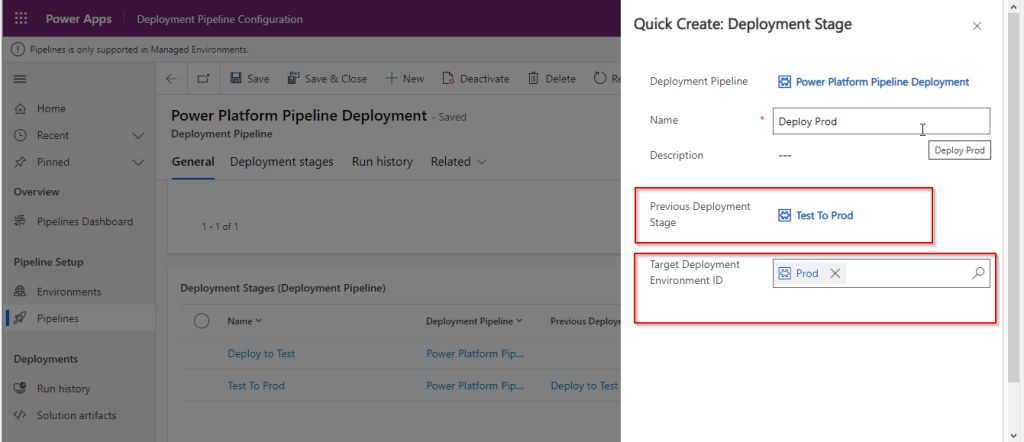
Next is configure your target environments for the pipeline to which you would like to deploy your solutions, from the quick create, give a name, choose your Previous Deployment Stage lookup and select the target environment you would like to Deploy from the lookup.
Once setup, your power pipeline should look something as below.
Note:While you are configuring the first stage to deploy to Test environment, you need leave the Previous Deployment Stage as empty.
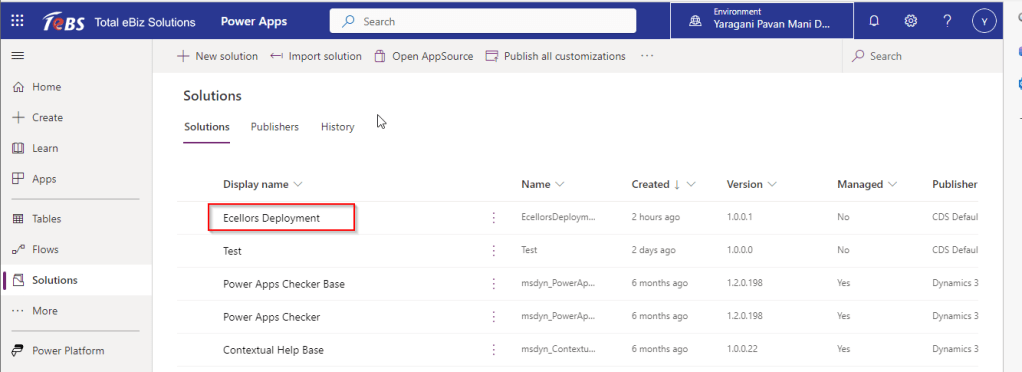
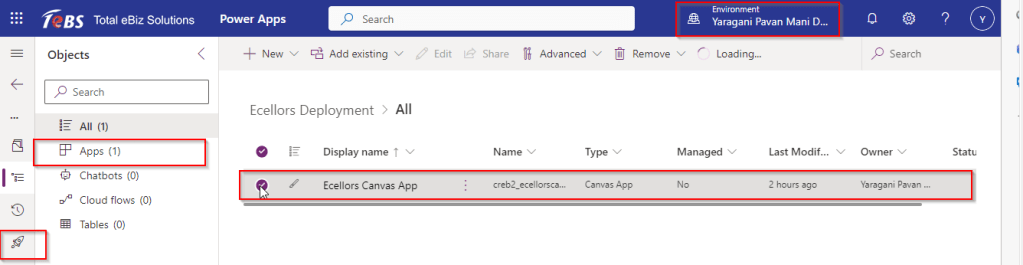
Now go back to your Development environment, include any power platform component which you would like to deploy to next environment, here for simplicity I added one Canvas App to the solution as below.
The Canvas App component added and as soon as you select or even before you should see a Pipeline symbol as highlighted below….
Note:This icon will be appeared if you have setup everything correctly, if you still don’t see this option when you try to deploy component from Dev, then you need relook at your configuration which you have setup in the host environment, either you gave the wrong environment Id or you configured incorrectly.
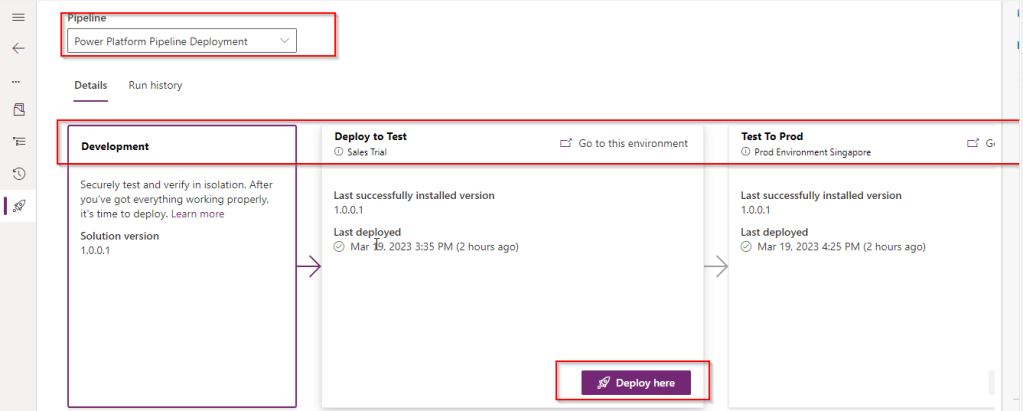
Once this icon is being shown, you are set to go…once you click on the Pipeline symbol, it takes you to a new screen showing your pipeline as below
All you need to just click on Deploy here and wait for a couple of mins to Deploy the solution to next environment to Test and you should see below screen. Then click on Deploy.
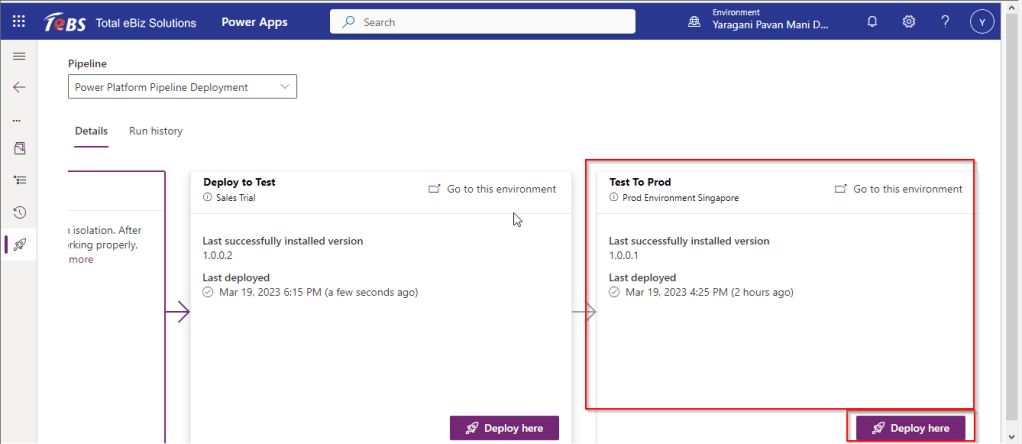
Once deployment is successful, then you should see Deploy to next environment(Prod) also enabled.
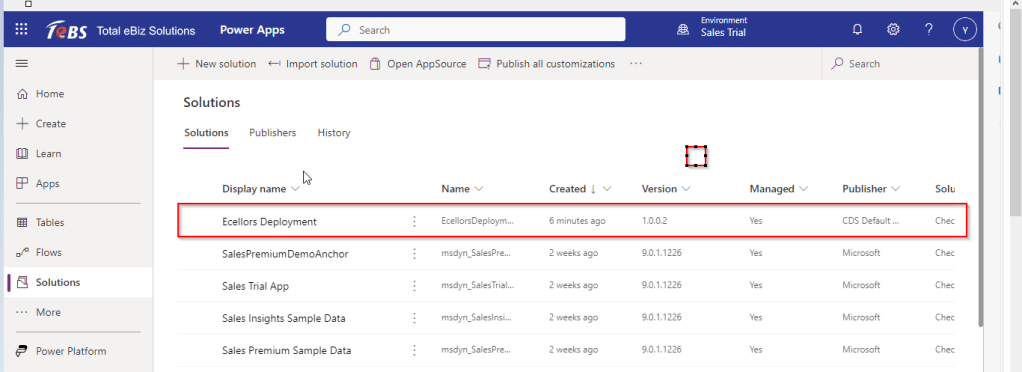
That’s it, lets see if our Solution is deployed to our Test and Prod Environment.
Prod Environment:
Tips:
Use environment names that indicate their purpose, I have used trial environments for demo purpose but this feature is Generally available, so you might try it out in your actual projects meaning the deployed solution will be managed and not editable as below.
Limitations:
Deleting the host environment deletes all pipelines and run data. Use caution and understand the impact of data and configuration loss as well as maker access to pipelines hosted in the environment.
After General availability all the environment will be automatically enabled as managed environments, so you don’t need to worry much about setting up the environment as Managed.
Licensing is also not a problem if you are a maker who’s creating the pipeline, you need to give the Deployment Pipeline Administrator and Deployment Pipeline User to the maker/user and share the pipeline for them to run it.
Hope you found this post helpful and you should definitely incorporate this feature in your projects to deploy managed solutions from one environment to another. How cool is this one….
Today I am writing about a simple tip about Power Automate trigger which exists from quite a while but many people might not know it…stop the suspense. Let’s get into the use case…for Power Automate flows running on a trigger..
Are you tired of making the action which triggers your flow each and every time, then you can use this tip..
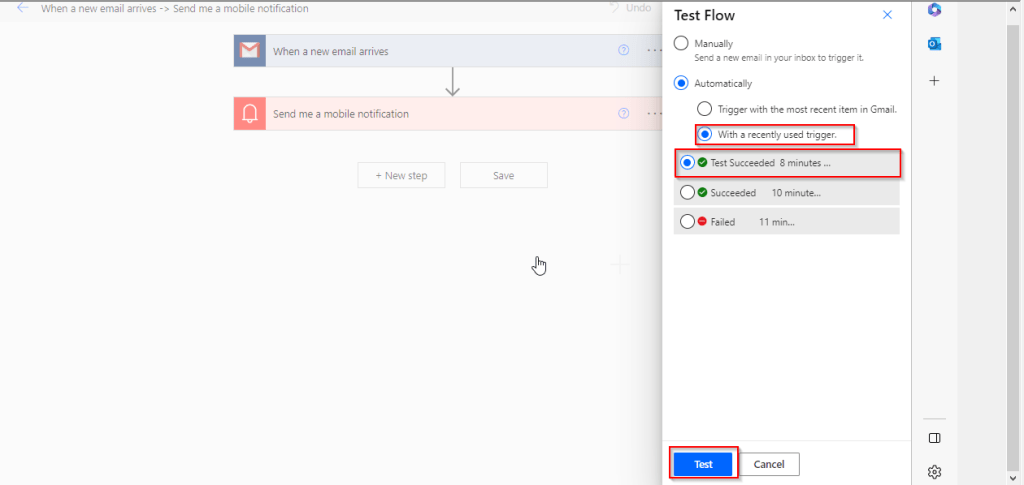
Just click on Test from top right bar as below..
Then in the pop up menu, select Automatically and check With a recently used trigger.
Later you can select any of the recently successful or failed executions to re-trigger your flow, no more hassles or manual actions to trigger your flow.
Hope this helps some one…trying to re-trigger their Automated cloud flows…without invoking their flow using an actual trigger.
In this digital era, every Power Platform individual want to make more with their data. So obviously there are gonna using Power BI to provide great insights with their data.
Coming to reporting, every one knows to create their visuals in Power BI Desktop and publish them to Power BI Service to view the Power BI Dashboards in Dataverse. This is common and known by everyone. But if you go a bit deeper and want to build some complex Power BI visuals, you were going to definitely use DAX(Data Analysis Expressions). If you were new to DAX, look at this tutorial to gain more information on how to write them.
Next step is when you were writing the DAX expressions, might be in Measures or Calculated functions(including calculated tables, calculated columns) you can’t just write them out at first shot and publish your reports. Definitely it takes time and effort to write them and make the look syntactically formatted so that every one can understand. So you may need to debug your DAX expressions before you actually use them in your reports. It’s when DAX Studio comes as savior which can be integrated with Power BI Desktop in few simple steps.
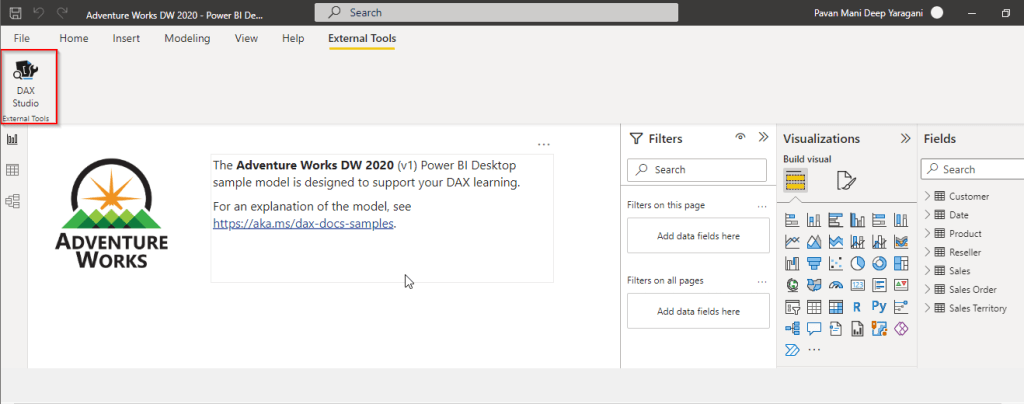
First step is to download DAX Studio and install it. As soon you are done, you should be able to see in external tools tab.
When you open any Power BI report, you can open them directly from DAX Studio.
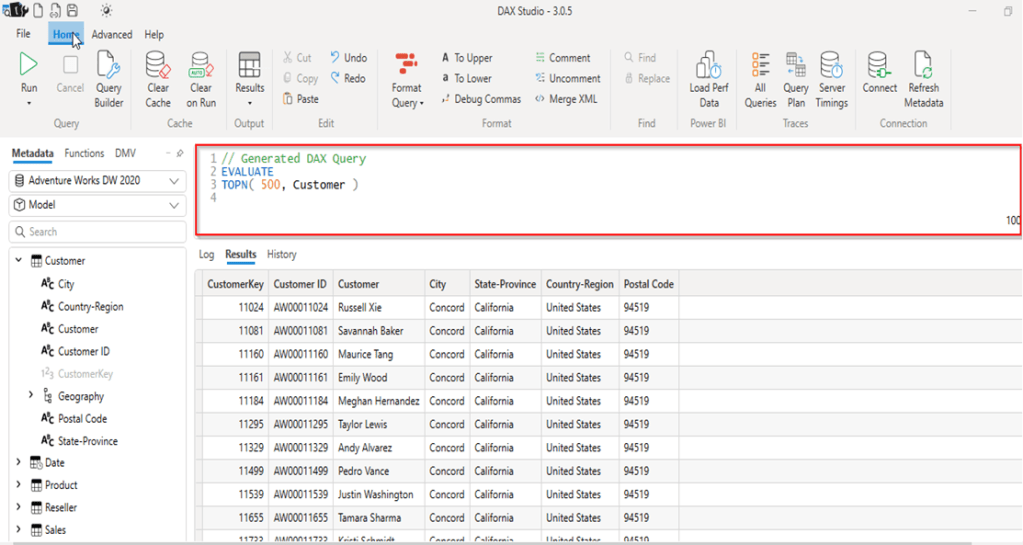
You can then open your DAX queries in your DAX Studio and then run/debug your queries, view the performance statistics etc.
DAX Studio is an open source tool which every BI Developer can leverage to improve your productivity in their projects.
I believe ever Power Platform professional working on Dataverse had one or other time got a chance to work on calculated fields. Actually it provides an easy way to perform any calculations for the supported data types since it has been introduced with CRM Version 2015 update 1.
Here is a very simple example of simple calculation to get your Fx data type up and running in few seconds….follow along….
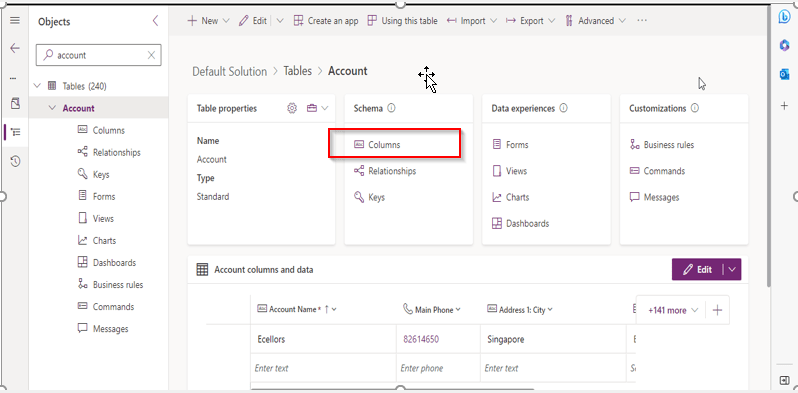
Open your solution, navigate to the columns in any table….for simplicity I am taking example of Accounts table…
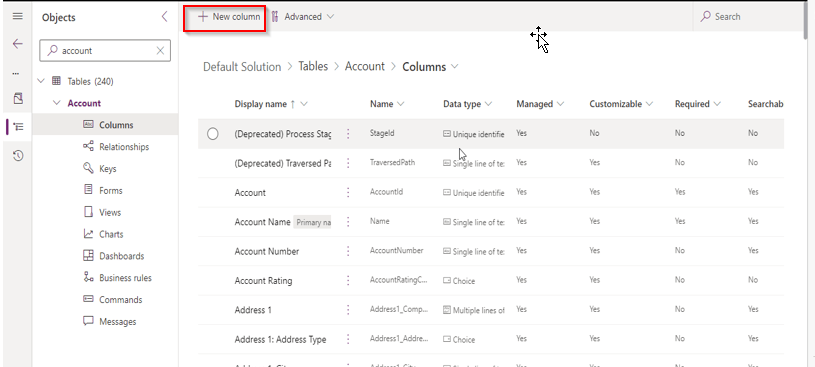
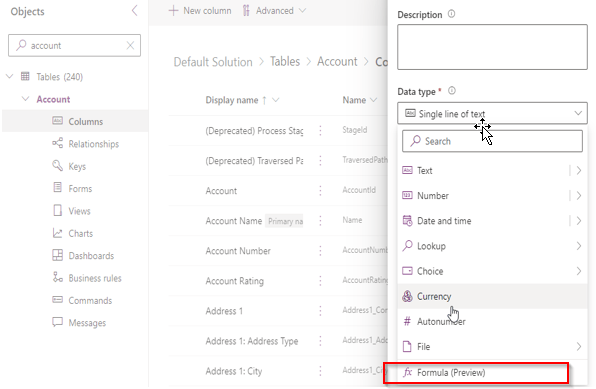
Now create new column as below
Key values for the field, make a note that the data type (Fx) is selected
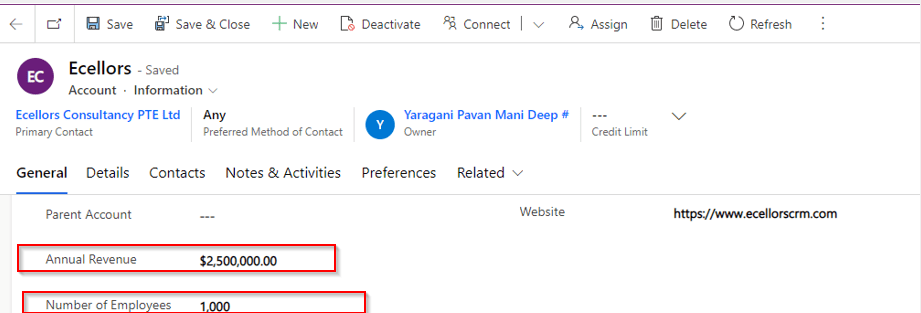
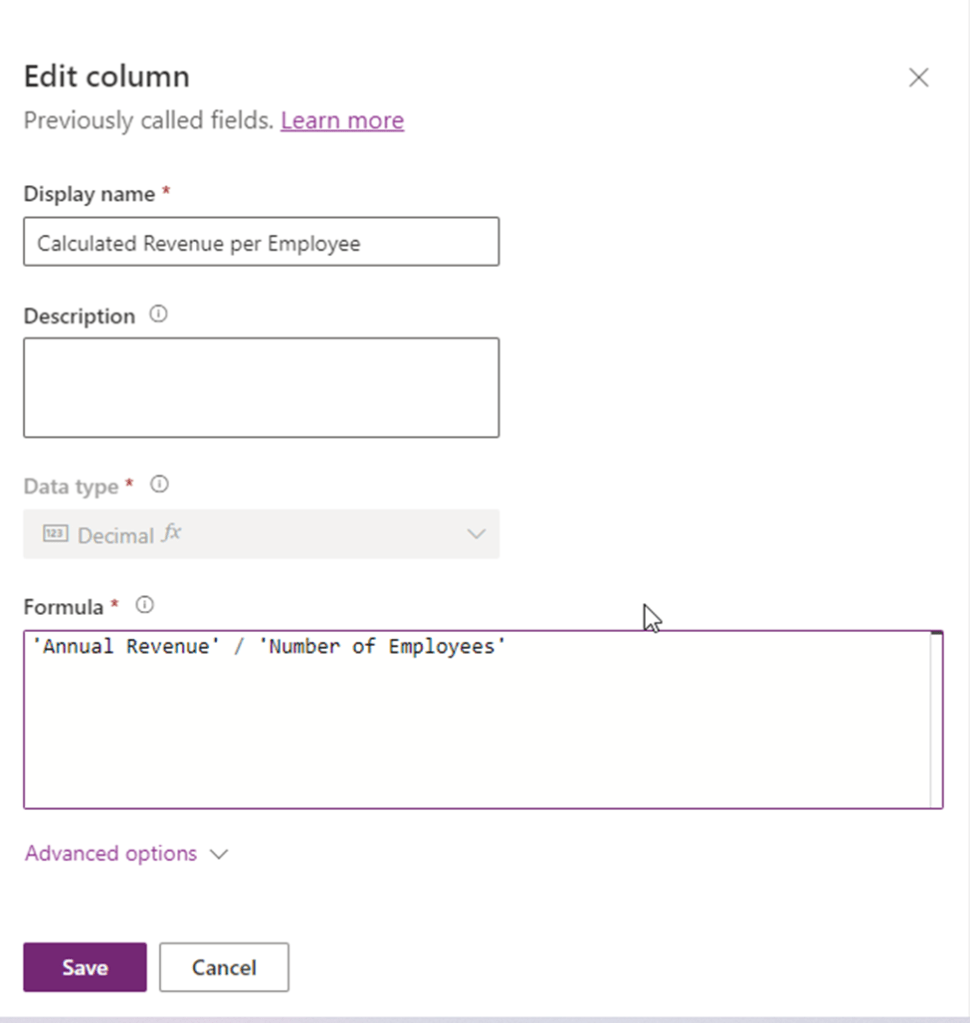
I already have two fields as below already on the form for calculating the Annual revenue per Employee from Annual Revenue of the company…
So now let’s write a simple Power Fx formula to calculate the Annual Revenue per Employee…the expression goes as below…
Annual Revenue is a currency field and Number of Employees field is single line of text. As soon as you save, system automatically identifies the data type as Decimal Number as shown above, click on save and publish the form…
Let’s see the actual use in the form…as soon as you enter the values for Annual Revenue and Number of Employees and save, the value for Calculated Revenue for the Employee field value will be calculated by the Power Fx expression.
Hope this will be useful in future for your implementations…
Points to keep in view:
This formula column is in preview right now at the time of writing this blog post.
And currently, formula columns can’t be used in roll-up fields or with plugins.
You can use the following operators in a formula column: +, -, *, /, %, ^, in, exactin, &
Microsoft Documentation says that the Currency data type isn’t currently supported but it works actually.
The Text and Value functions only work with whole numbers, where no decimal separator is involved
Today in this blog post, I would like to share how we can quickly set up Postman Environment to test out the Dataverse API’s right away. It’s very easy and doesn’t need any Client Id, Client Secret registration in Azure AD for Authorization if you follow these steps as the provided Client id works for all Dataverse environments, so let me take you through.
You just need to have a Dataverse environment that you can connect to and Postman desktop App in your machine(Preferably windows)
Lauch the Postman desktop application
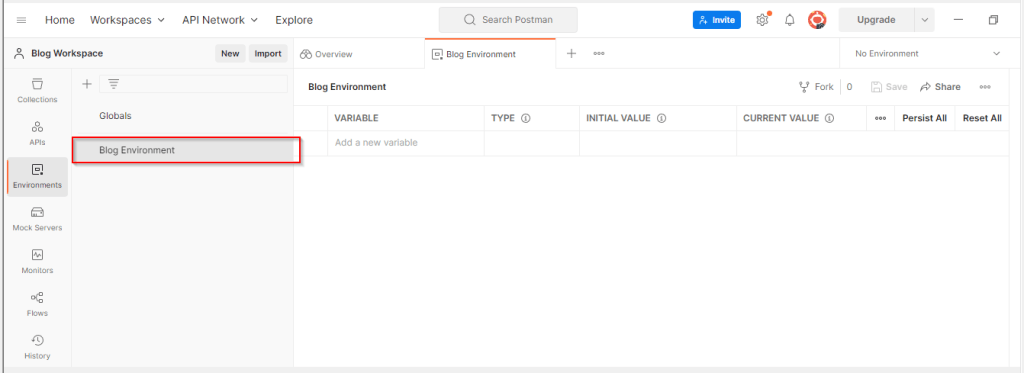
Create the environment by click
3. Enter a name for your environment, for example, Blog Environment as below
4. Get the Web API end point URL for your environment with few simple steps as below…by going to Developer resources in make.powerapps.com
Then copy the Web API endpoint URL as below…
Next step is to add following key value pairs in Postman for connecting to Dynamics..please make sure you use the same clientid(51f81489-12ee-4a9e-aaae-a2591f45987d), it is the same to connect to any Dataverse environment.
Your updated configuration should look something as below in the Postman.
Click on save to save your newly created environment as highlighted below..
Now all you need is to generate access token in order to authenticate with your Dataverse environment to connect using OAuth 2.0
Follow the simple steps below..
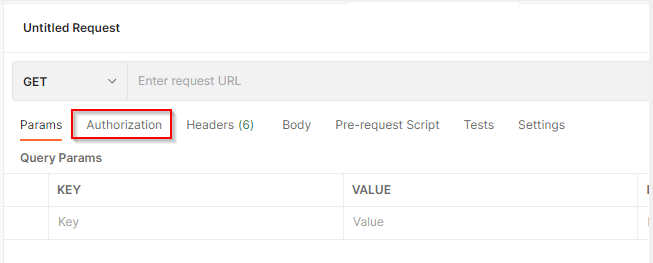
Click on newly created environment, click on + symbol besides it as highlighted below
The following pane appears. Select the Authorization tab.
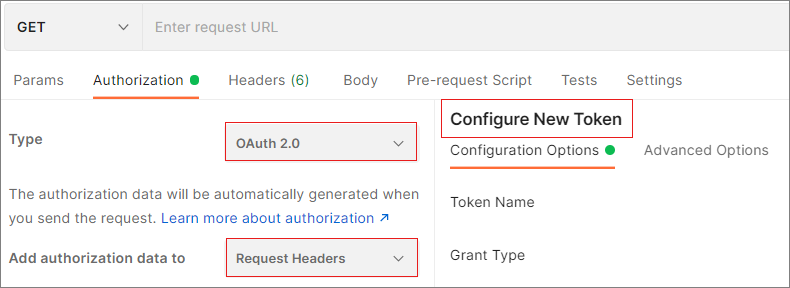
Set the Type to OAuth 2.0 and set Add authorization data to to Request Headers, if you scroll down a bit, you will be able to see Configure New Token option as below, else you wouldn’t.
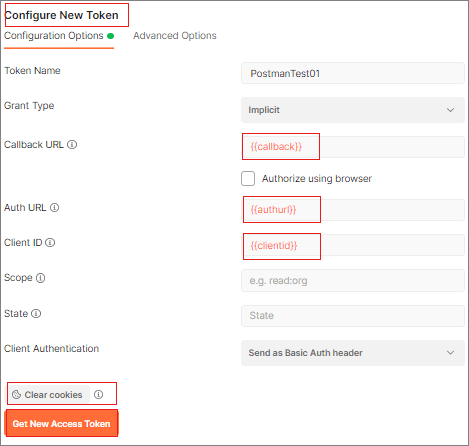
In the Configure New Token pane, set the following values:
Name
Value
Action
Grant Type
implicit
Choose implicit from the drop-down
Callback URL
{{callback}}
Copy the value
Auth URL
{{authurl}}
Copy the value
Client ID
{{clientid}}
Copy the value
The settings should appear as below
Tip: If you were using the Postman to connect to multiple dataverse instances, make sure you clear your Cookies inorder delete the cookies in Postman.
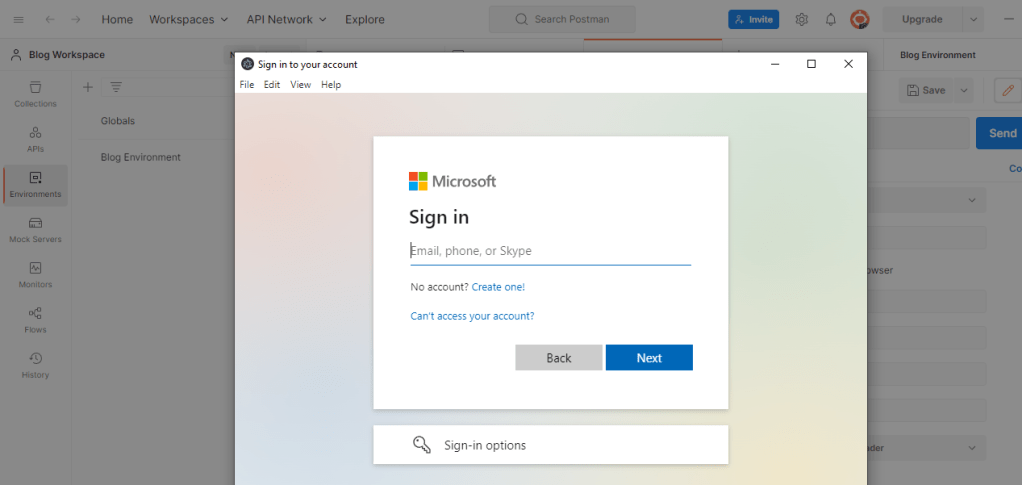
Click on Get New Access Token button, within a moment, you should see a Azure Active Directory pop up to Authenticate your login from browser.
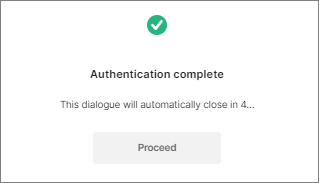
Click Get New Access Token.Once you click Get New Access Token, an Azure Active Directory sign-in dialog box appears. Enter your username and password, and then click Sign In. Once authentication completes, the following dialogue appears and just get the token with few more steps as below.
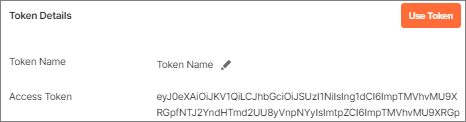
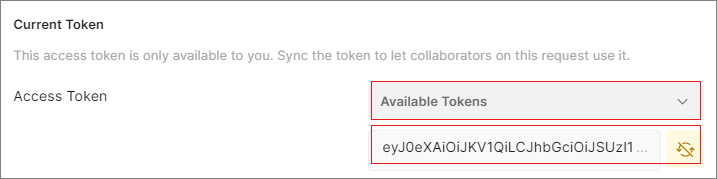
After the authentication dialogue automatically closes in a few seconds, the Manage Access Tokens pane appears. Click Use Token.
The newly generated token will automatically appear in the text box below the Available Tokens drop-down.
Test your connection
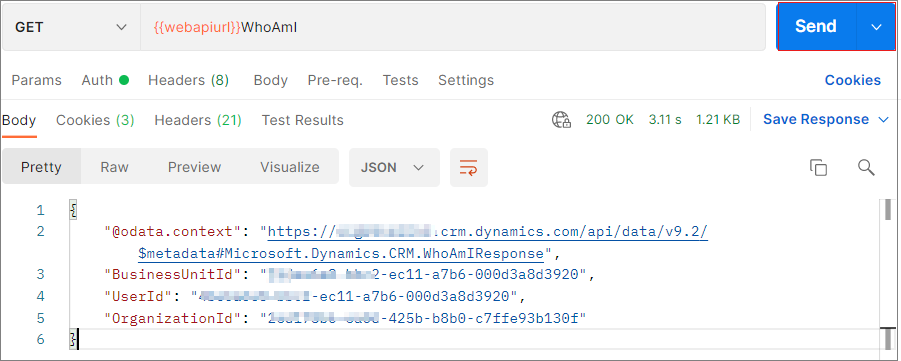
The following shows how to test your connection using WhoAmI:
Select GET as the HTTP method and add {{webapiurl}}WhoAmI in the editing space.
Click Send to send this request.
If your request is successful, you will see the data returning from the WhoAmI endpoint, like below:
Hope you have found this post useful…when you were working with Dataverse API’s.
In this blog post, I would detail about how you can you work with Code Components, it just takes only few minutes of your valuable time. Now-a -days everyone is moving from traditional HTML Webresources to PCF Code components. I used to be a pro-HTML Developer where I always want to always know how my code is running in browser. Usually every developer wants to try out how their code is working in local before proceeding further. So here we will see how you can run your component locally…and once tested we can deploy them to Dataverse.
So without any further due, let’s get into it…
Firstly you can download these code components from this link, now let’s see how we can use these components in our Apps. Follow with me with few simple steps as below..
2. Navigate to the folder and extract the zip file.
3. Open Visual Studio Code and navigate to that folder location(Many people suggest to use Visual Studio Developer Command Prompt, but believe me this is a lot easier)
The component’s run time can be found by navigating to the respective folder of the component..
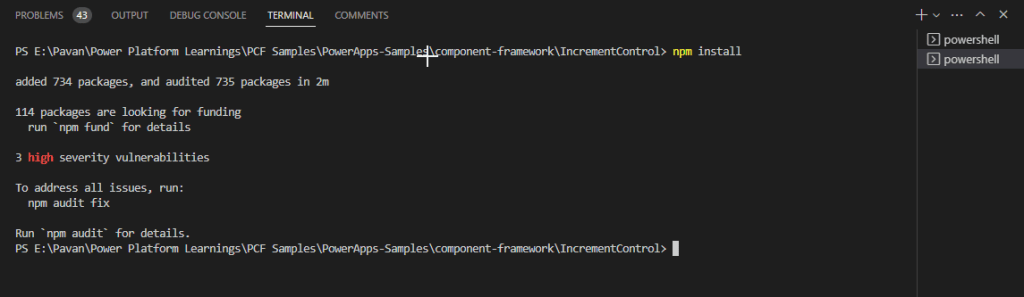
4. Open a new Terminal and execute npm install command(I am assuming that you have node installed in your machine for working with this), this will add all the dependencies to the component folder, it should look something like below..
5. As this control is a prebuilt one, no need to execute build command.
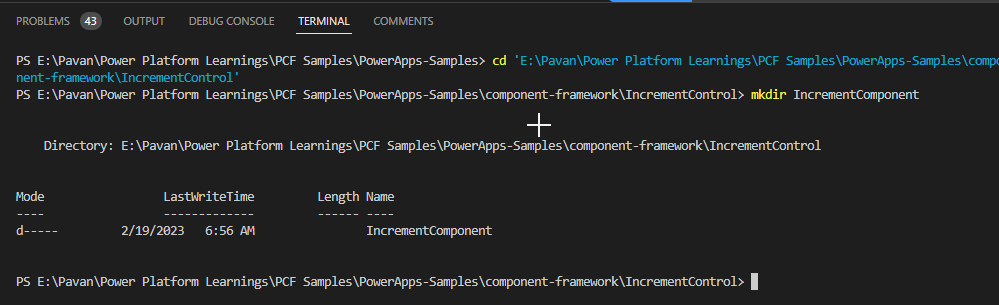
6.Create a new folder using the command mkdir <folder name> inside the sample component folder and navigate into the folder using the command cd <folder name>, something like below…here I have named the component folder as IncrementComponent.
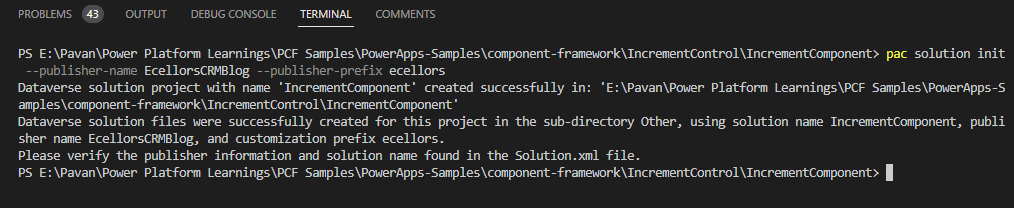
7. Now we will proceed with next steps of creating a new solution project inside the same folder using the following command:pac solution init --publisher-name <Name of the publisher> --publisher-prefix <Publisher prefix>
It should look as below
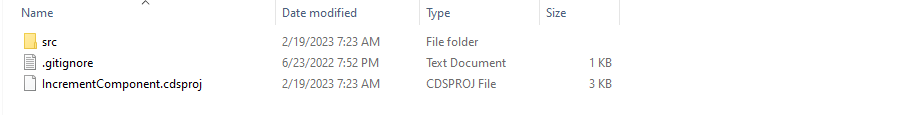
You should see solution folder components being updated as below
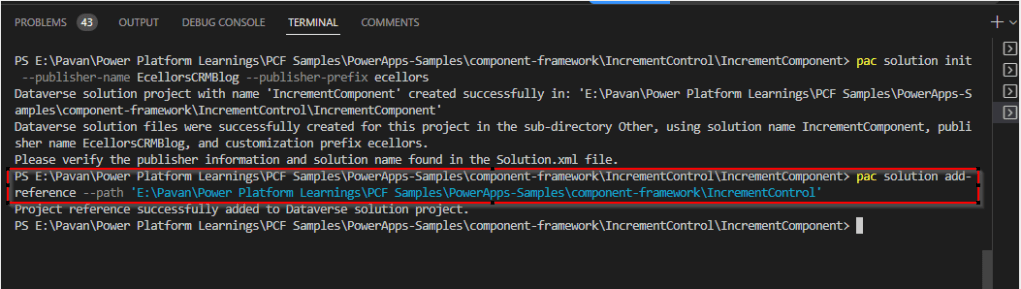
8.After the new solution project is created, refer to the location where the sample component is located. You can add the reference using the following command:pac solution add-reference --path <Path to the root of the sample component>
It should look as below
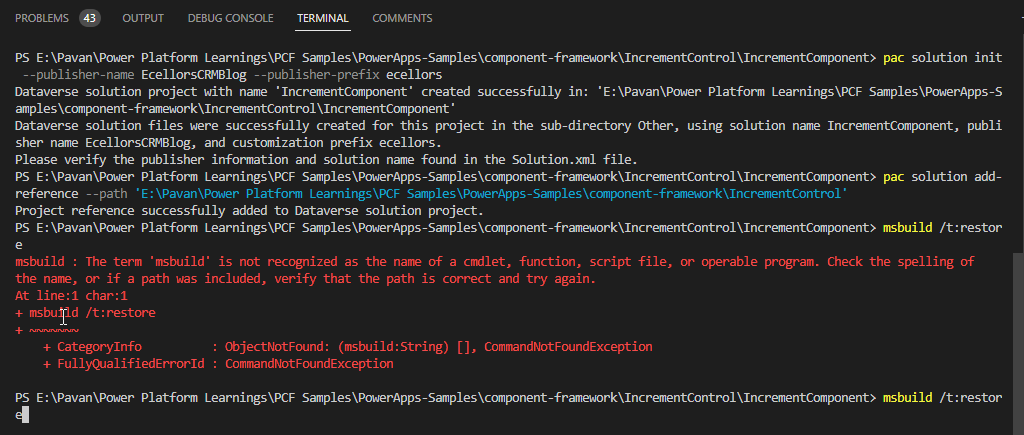
10. Now you have to generate a zip file from your solution project by building the project using the following command:msbuild /t:restore
Oops, you get an error as below…in order to resolve
If you just try to reverse engineer, the above error says that ‘msbuild’ is not recognized and instructs to check the path variable.
Inorder to fix this, I have followed blog and with minor tweaks, able to resolve the issue, i.e. if you have 64 bit Visual Studio 2022 version, you have to use the below path for environment variable instead of the one specified in the above blog.
Then you should be able to overcome the above error…and you should see a screen something same as below
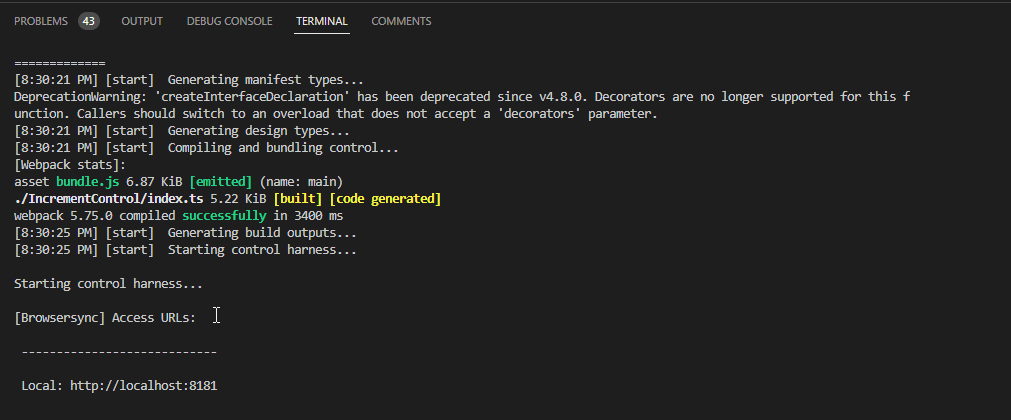
The next step is to run your Code component in local test harness and see how if behaves before actually pushing to dataverse…so use the following command npm start while making sure terminal points to the exact folder location…
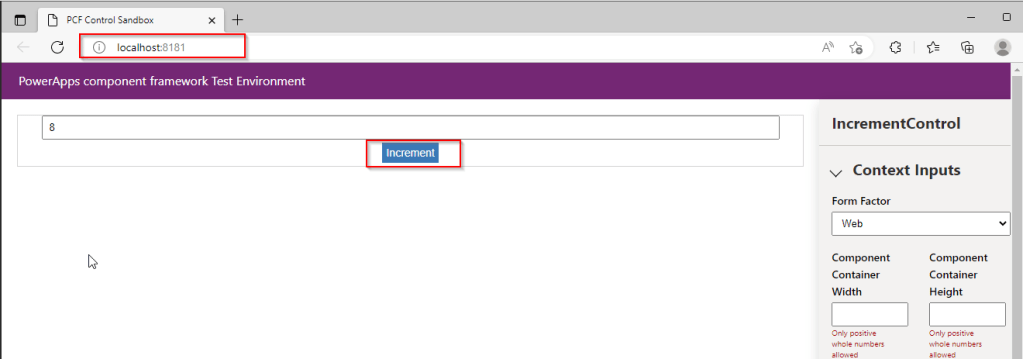
Now the code has been run in your browser, you just need to verify by going to the mentioned URL in the local machine.
There it was, you can see your component running in your local browser window….
These code components can be used in Canvas Apps, Model Driven Apps, Power Portals and adds much more flexibility than customizing with HTML Webresources.
Now you can use msbuild /t:restore command to create a zip file, we are good to use the PCF control by importing it to CDS.
Limitations:
Microsoft Dataverse dependent APIs, including WebAPI, are not available for Power Apps canvas applications yet.
Code components should bundle all the code including external library content into the primary code bundle. To see an example of how the Power Apps command line interface can help with bundling your external library content into a component-specific bundle, see Angular flip component example.
Code components should not use the HTML web storage objects, like window.localStorage and window.sessionStorage, to store data. Data stored locally on the user’s browser or mobile client is not secure and not guaranteed to be available reliably.
You can learn more about PCF Here…hope this helps….
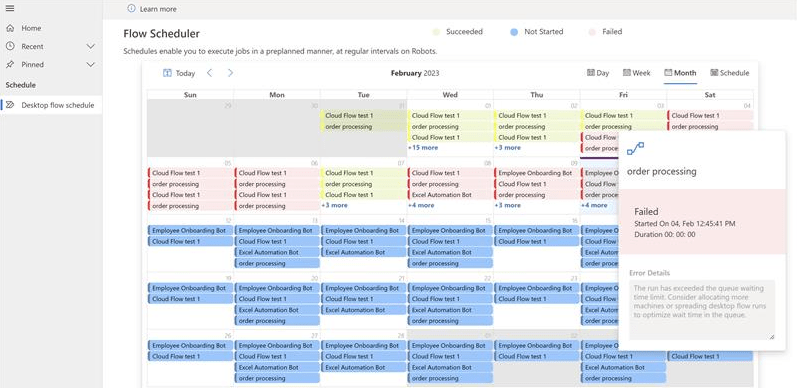
Have you ever thought of a tool where you can review all your scheduled flows at once in one dashboard, then I am glad to introduce you the latest capability from Microsoft which is none other than Automation Kit.
If we get into detail, the Automation Kit is set of tools that accelerates the use and support of Power Automate for desktop for automation projects. HEAT is guidance that’s designed to help you deploy the automation platform and manage the entire lifecycle of an automation project.
The key features of this Automation Tool Kit:
The ability to view the schedule of Recurring cloud flows
View schedule by Day, Week, Month and Schedule view
View the status of Scheduled flows (Success, Failure or Scheduled)
View the duration of a Cloud Flow run
View the details any any errors
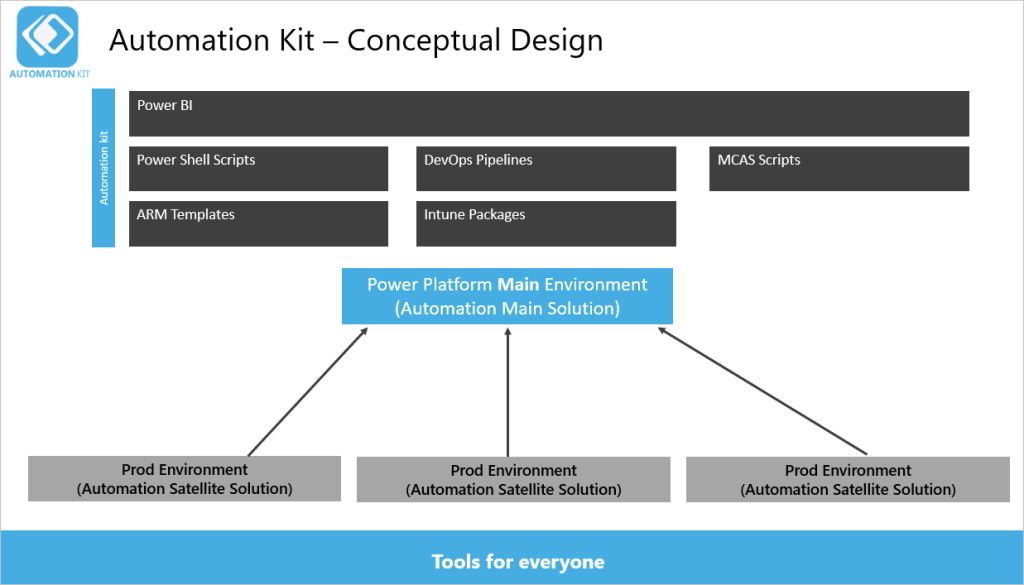
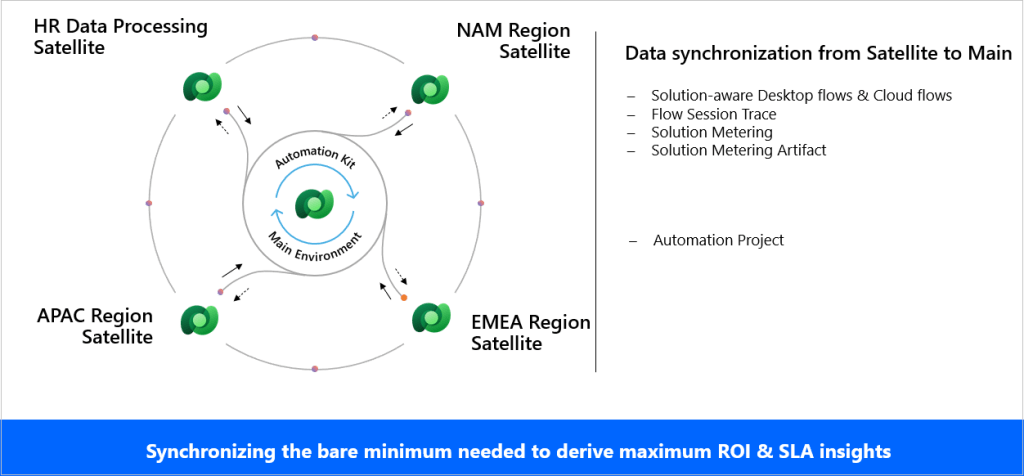
The key element of the solution is the Power Platform main environment.
There are usually several satellite production environments that run your automation projects. Depending on your environment strategy, these could also be development or test environments.
Between these environments there is a near-real-time synchronization process that includes cloud or desktop flow telemetry, machine and machine group usage, and audit logs. The Power BI dashboard for the Automation Kit displays this information.
Automation Kit components
The Automation Kit supports an automation CoE with the following components:
Automation Project: This project is a canvas app that supports requesting automation projects and submitting them for approval.
Automation Center: This is a model-driven app that organizations can use to create and maintain automation assets, such as master data records, map resources and environments, and assign roles to employees.
Automation Solution Manager: This is a canvas app in satellite environments that enables the metering of solutions and their artifacts.
Cloud flows: These cloud flows use Dataverse tables to sync data from satellite environments, in near real time, to the main environment.
A Power BI dashboard that provides insights and monitors your automation assets.
These two solutions contain the components in the kit.
The main solution, which you deploy to the main environment.
The satellite solution, which you deploy in each satellite environment.
Limitations:
Only Power Automate Desktop and Power Automate solutions contained within a solution are displayed
At least one Power Automate Desktop has been registered and executed


![Power Fx Fomula Data type – your new companion in addition to Calculated fields in Dataverse [Insight]](https://ecellorscrm.com/wp-content/uploads/2023/03/power-fx-template.png?w=1200)