Hi Folks,
This is another post related to Plugins in Dynamics 365 CE.
Considering medium to large scale implementations, there isn’t a single Power Platform Project which don’t require merging of external assemblies.
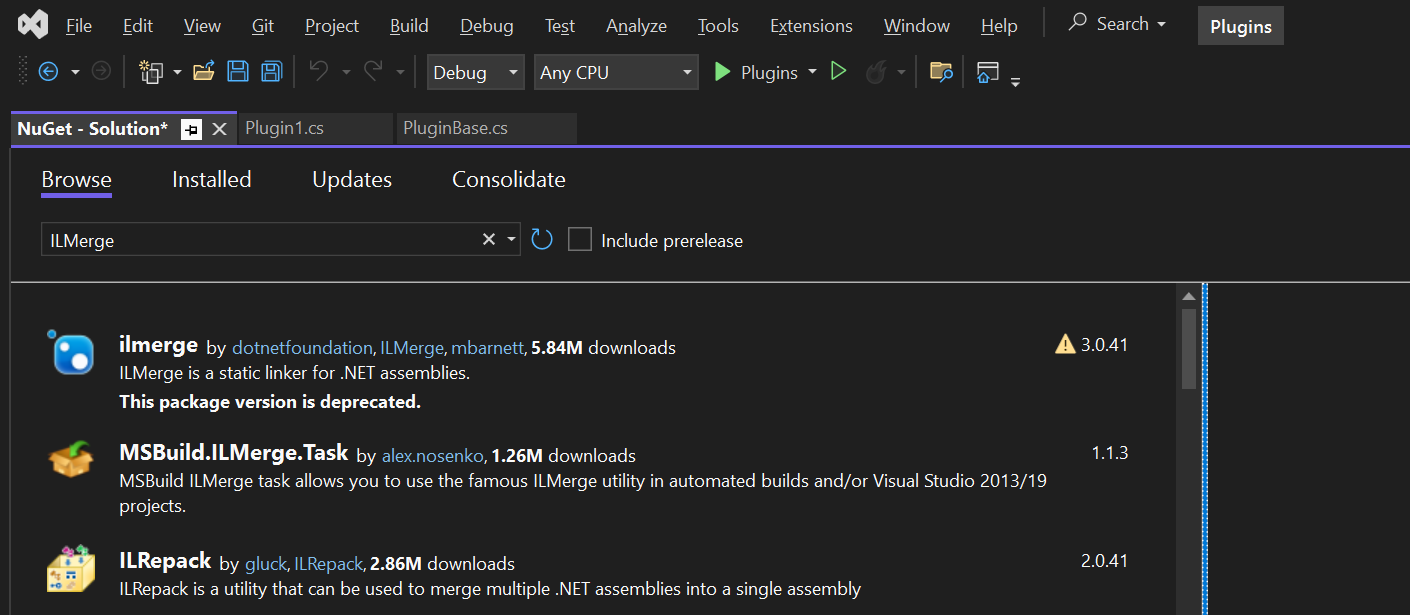
We relied on ILMerge to merge those assemblies into a single DLL. We used to search for ILMerge assemblies in Nuget and installed them for use.
Then the plugins are signed in for several reasons, primarily related to security, assembly integrity, and versioning of the sandbox worker process.
But either of the above are no longer needed with the help of Dependent Assembly feature…with few simple steps, you can build the Plugin…Interesting, isn’t it, read on…
Pre requisites:
- Download Visual Studio 2022 Community Edition here
- Download VS Code from here
- Download Plugin registration tool from here
- Download PAC CLI from here
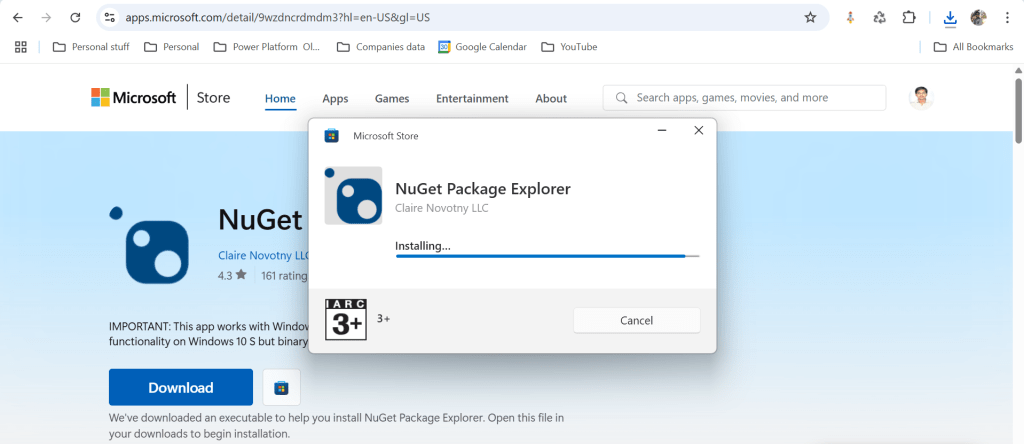
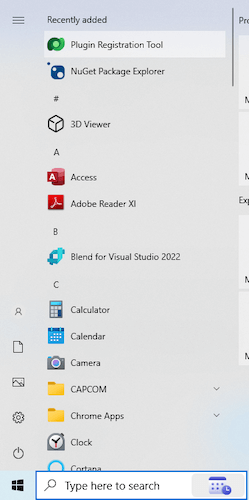
- Download and install NuGet Package Explorer from this link NuGet Package Explorer open the NuGet Package Explorer
Avoid Direct Plugin Project Creation in Visual Studio
- Never create a Plugin project directly from Visual Studio or any other IDE here after.
Use Microsoft PowerApps CLI instead
- Always use Power Apps CLI as it easy and only requires a single command to create the entire Plugin project scaffolding
- This ensures a standardized and reliable development environment.
- It automatically creates a Nuget Package file that will be used to avoid ‘Could not load assemblies or its dependencies‘.
Ok, let’s begin.
Once you have downloaded all the prerequisites mentioned, make sure you have installed them in your local machine. Others are straight forward to download, for NuGet Package explorer, you need to search in Windows store to install.
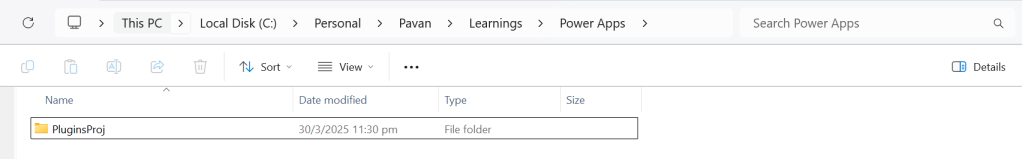
- Create a local folder for the Plugins
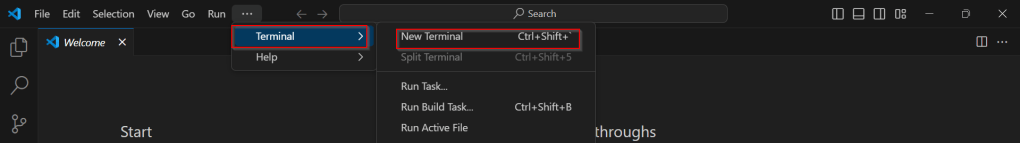
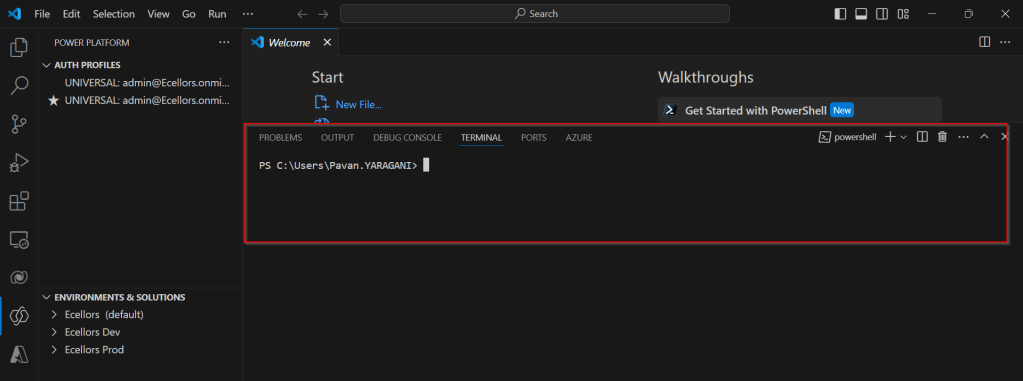
Navigate to that folder from VS Code
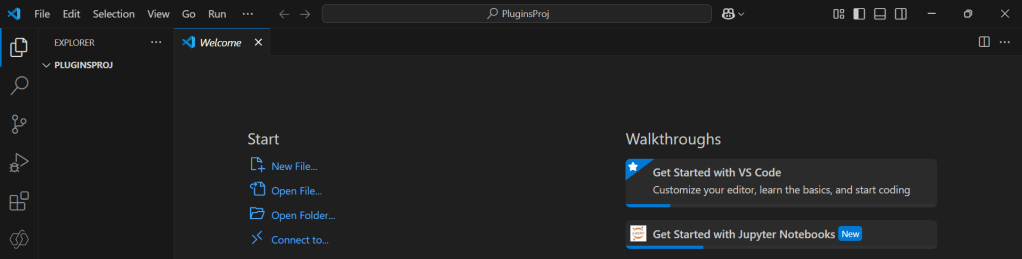
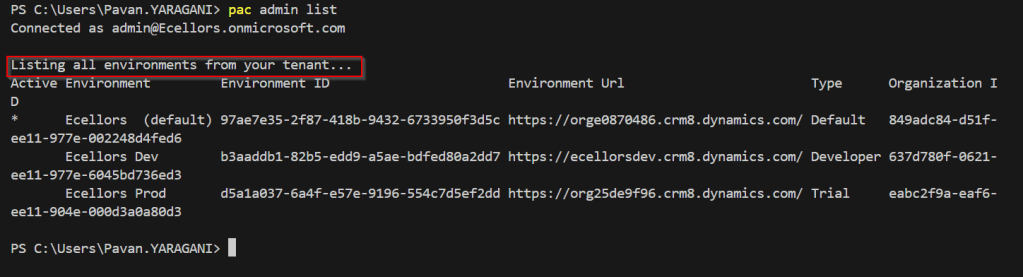
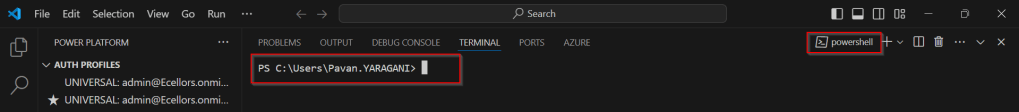
Now open terminal, run the pac command as below
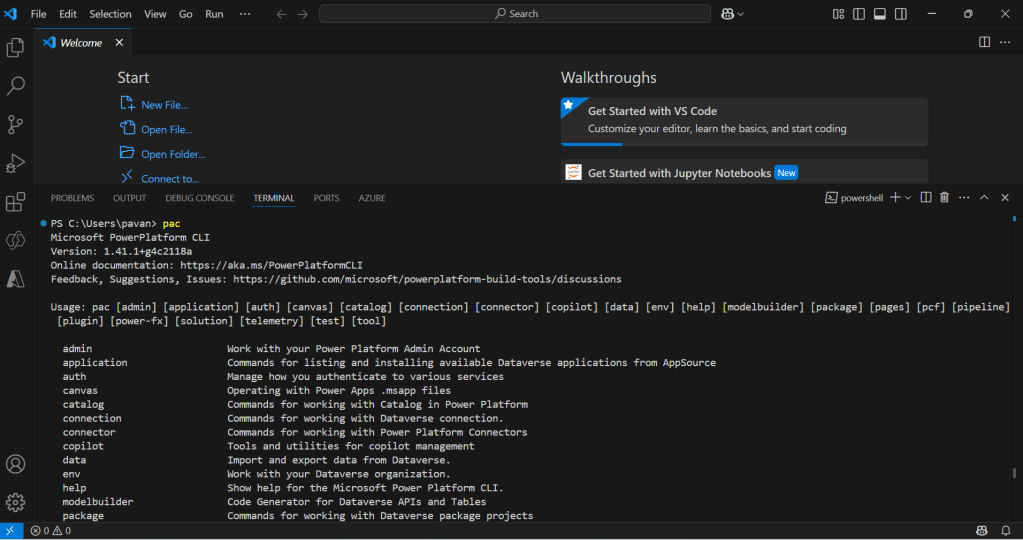
Execute the following command to create plugin project
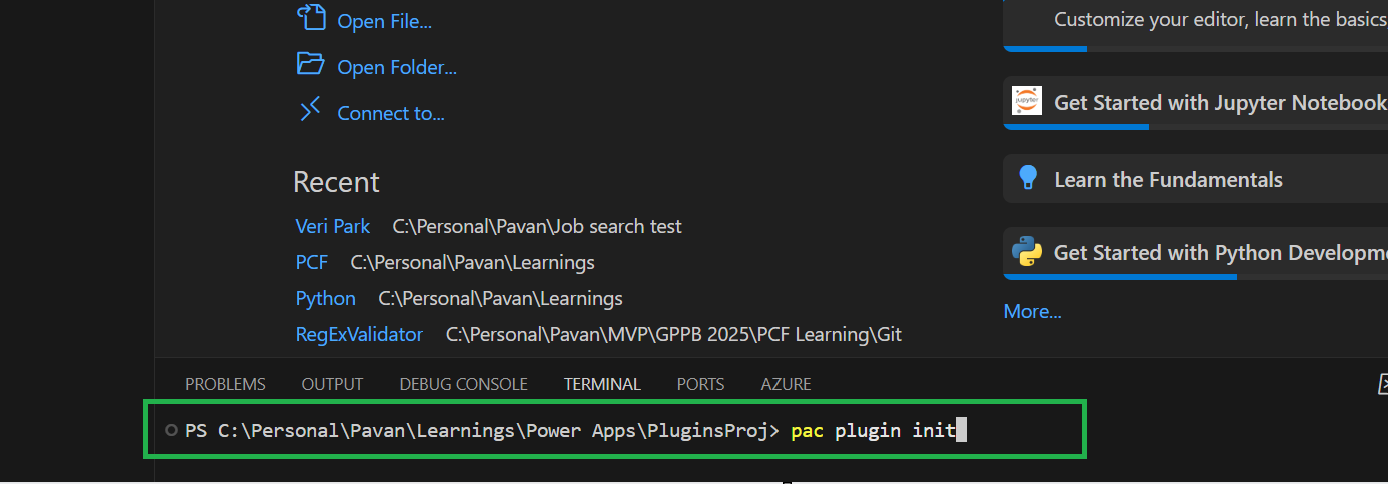
- Browse to the directory where you want to create the plugin project
- Execute the command on CMD to create plugin project “pac plugin init“
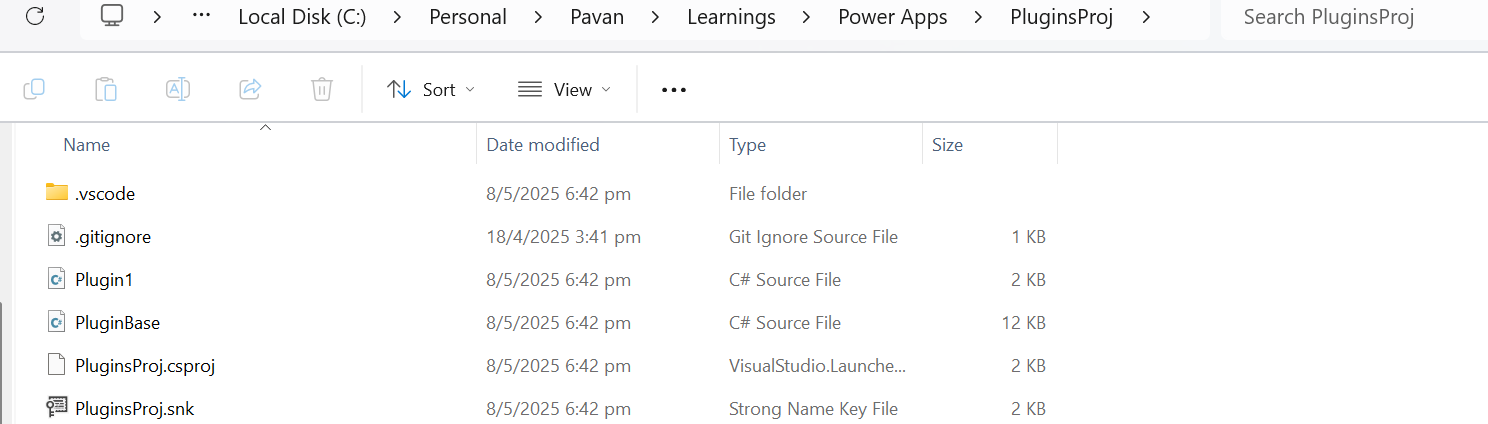
A plugin project will be created at your desired location as follows
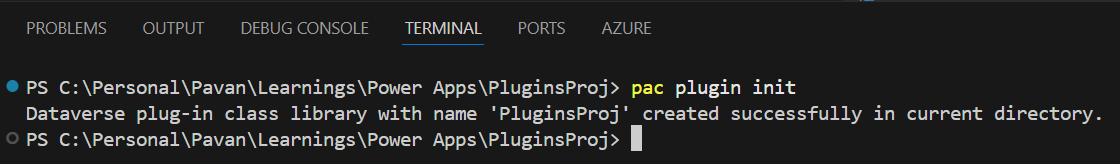
Plugin project in local folder will be created as below
That’s it, you can close the VS Code for now.
Click on the CS Proj file and open it in Visual Studio
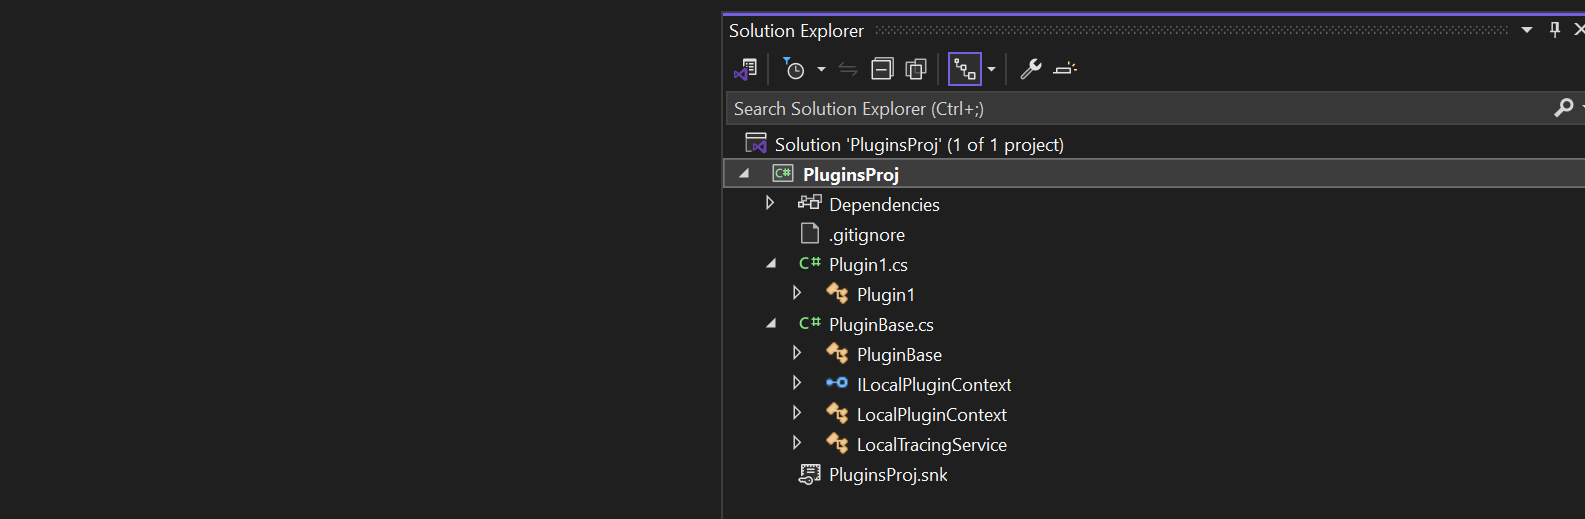
By default, 2 files are automatically created when you create a plugin project as shown above.
Now will install Bouncy Castle which is an external library, right click on the Plugin Solution –> Manage Nuge Packages
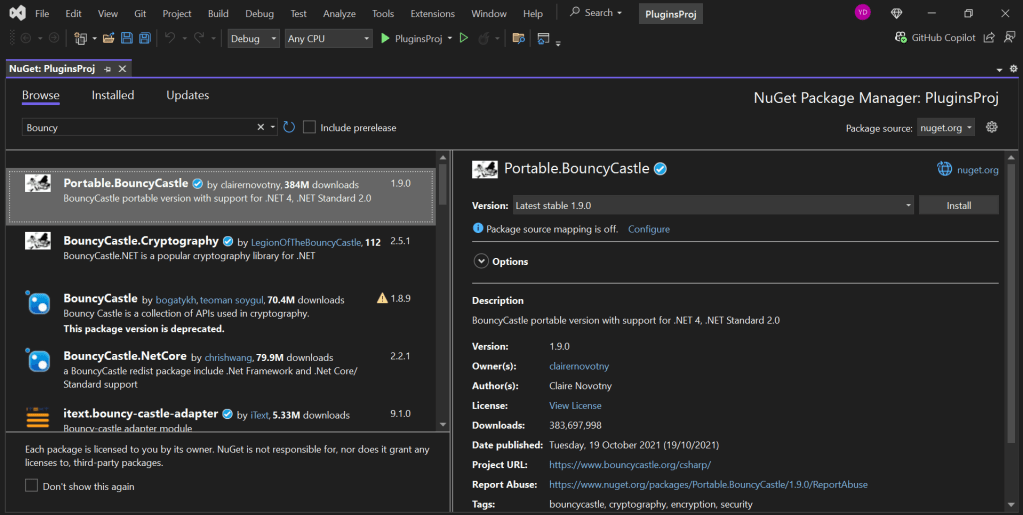
I have added Bouncy Castle NuGet Package to my plugin project for Encryption and Decryption. You can have your own required NuGet Package as per your need.
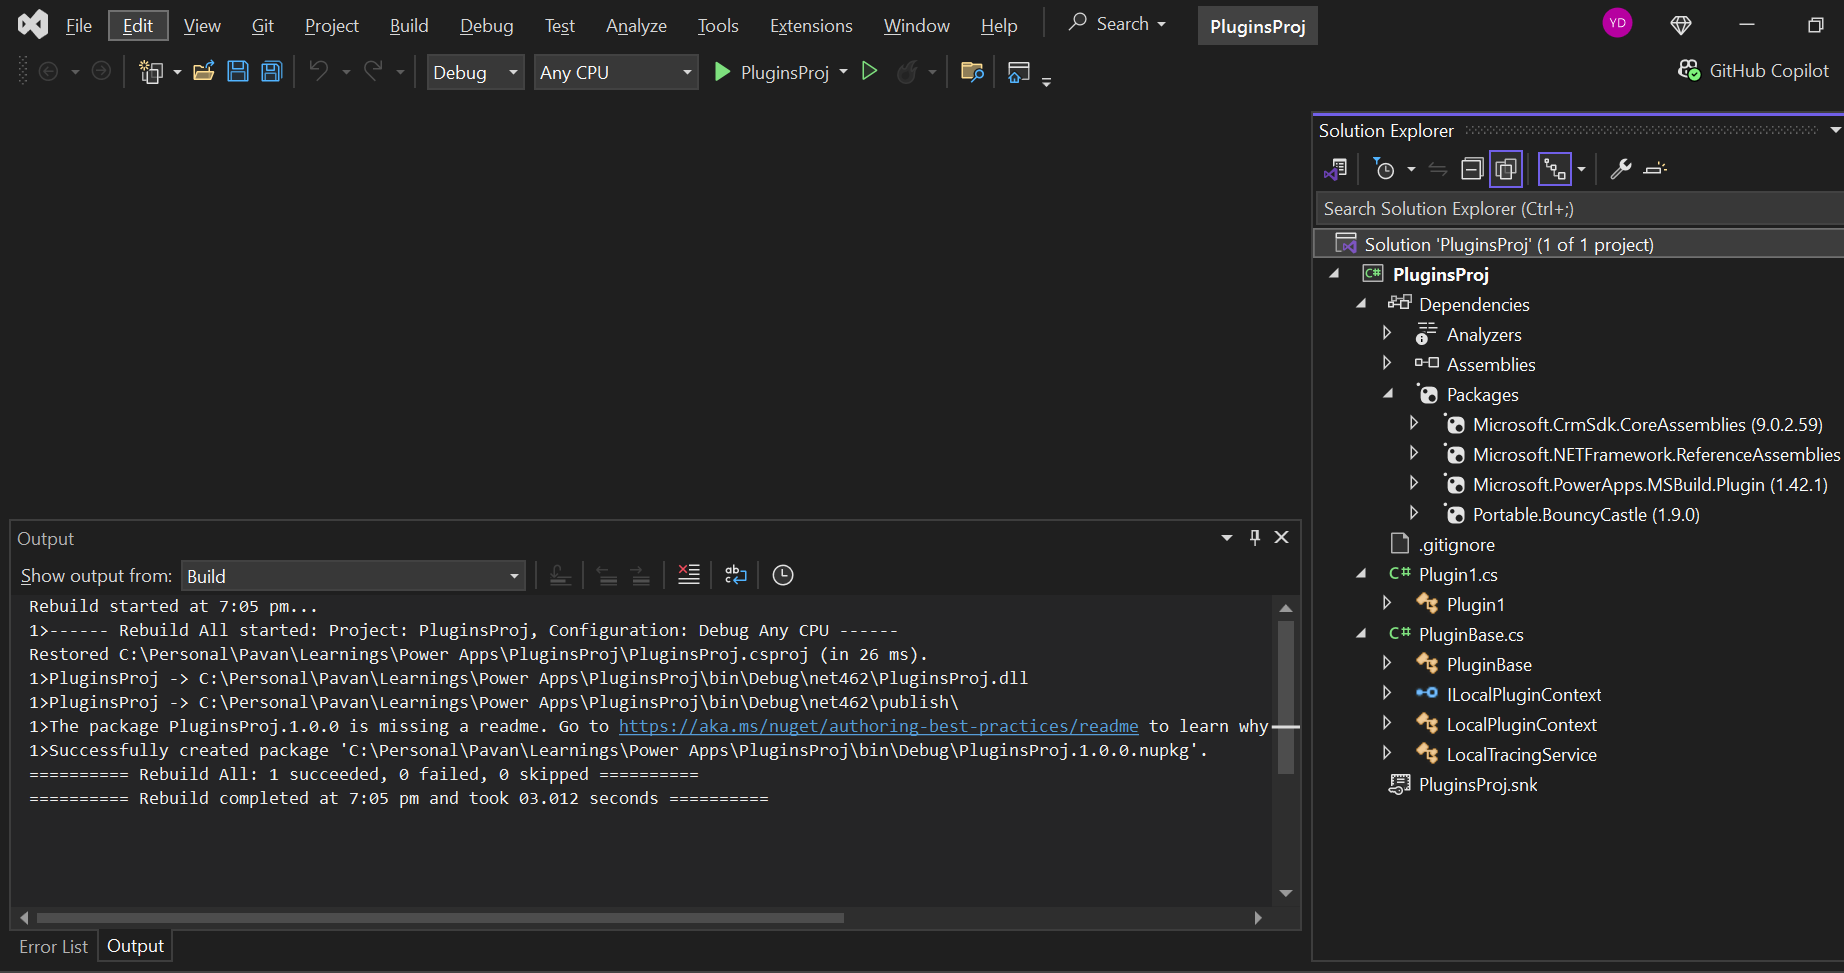
Build your project
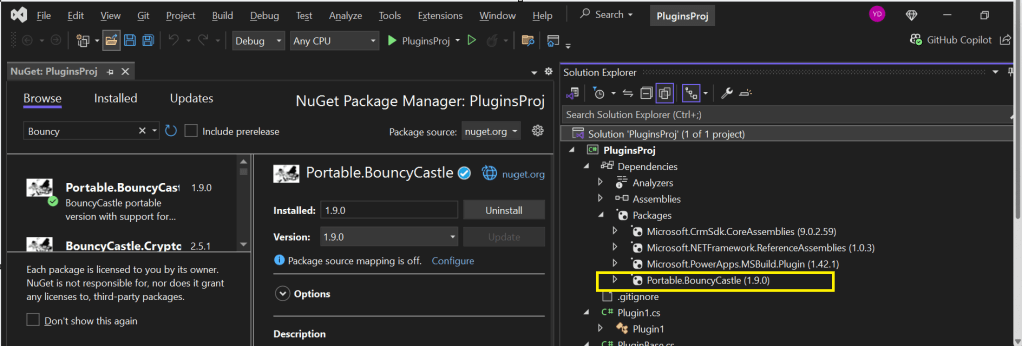
After a successful build, you will get the output result as follows
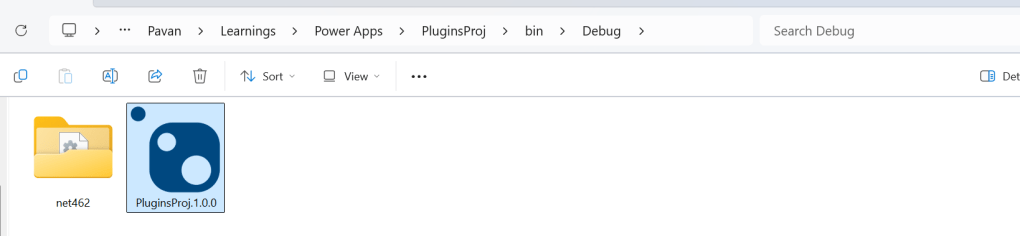
Browse the directory of your project
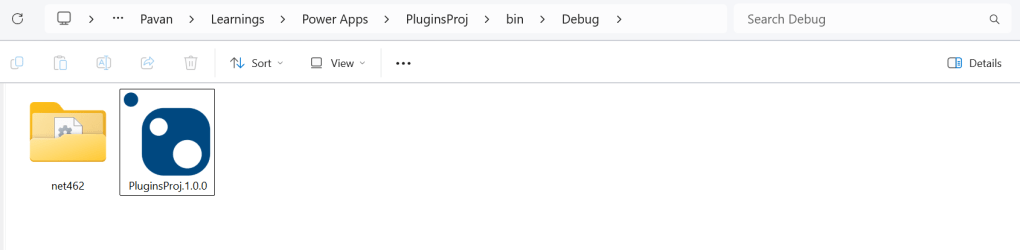
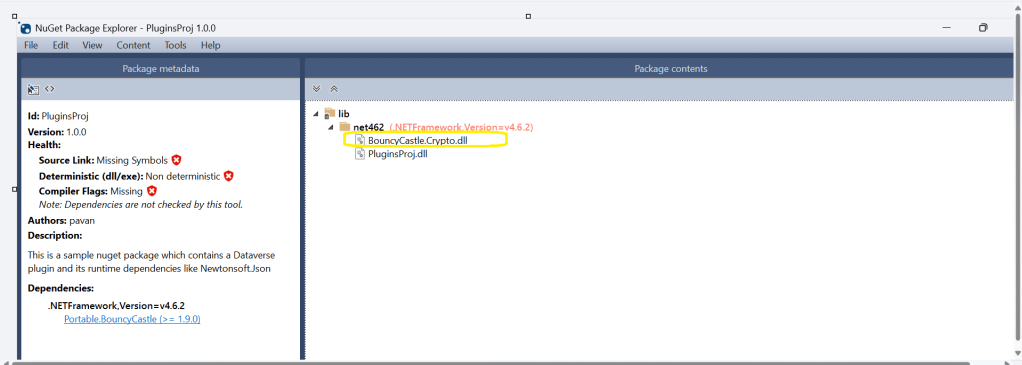
Open the file Plugin_Project.1.0.0.nupkg in Nuget Package Explorer by double clicking it
Now you can see that this nuget package file contains the information related to the added nuget package of Bouncy Castle that we want to include in our plugin project package as follows. In your case, you can have the required nuget package that you want to add
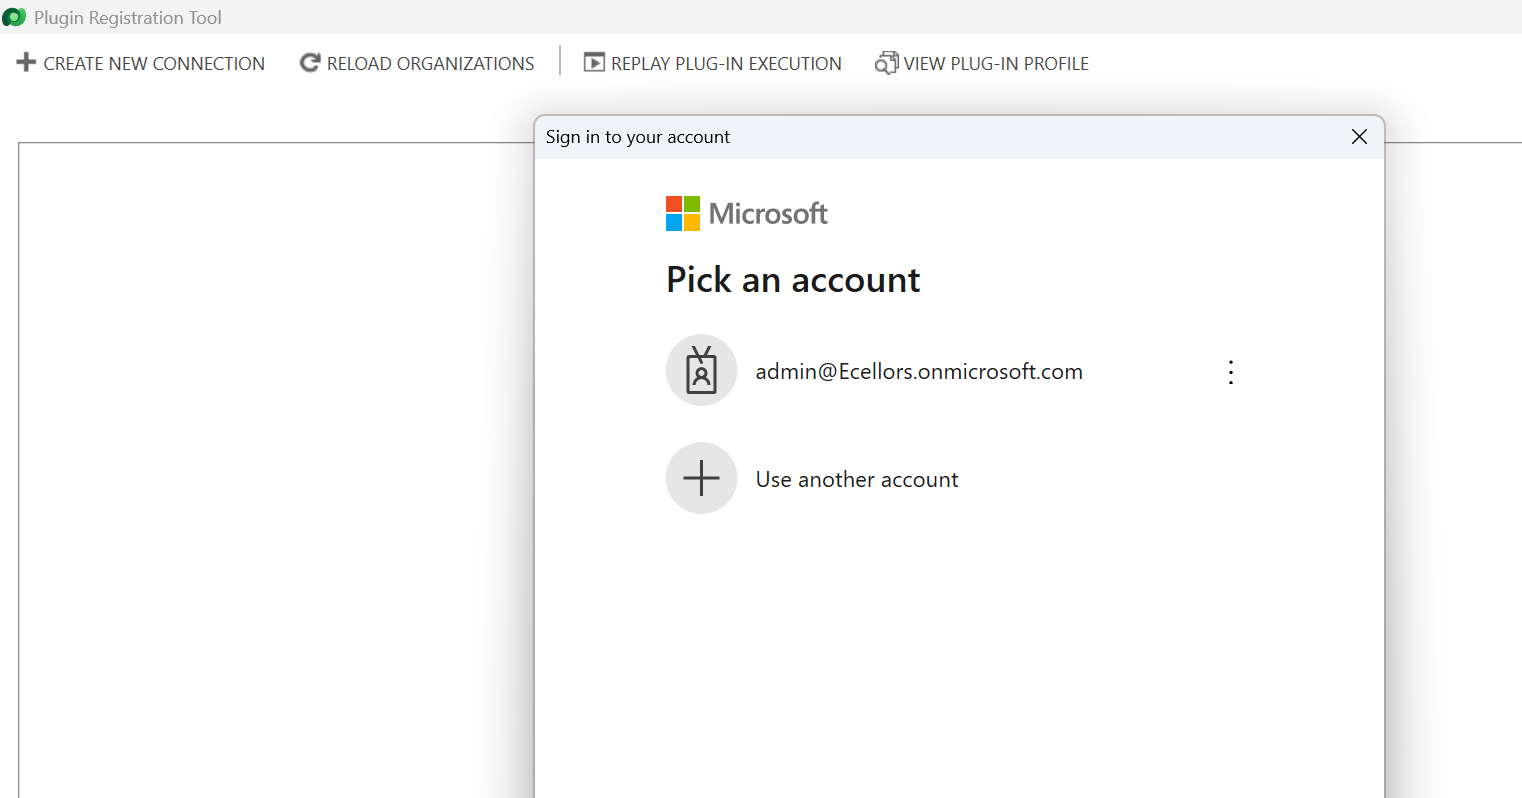
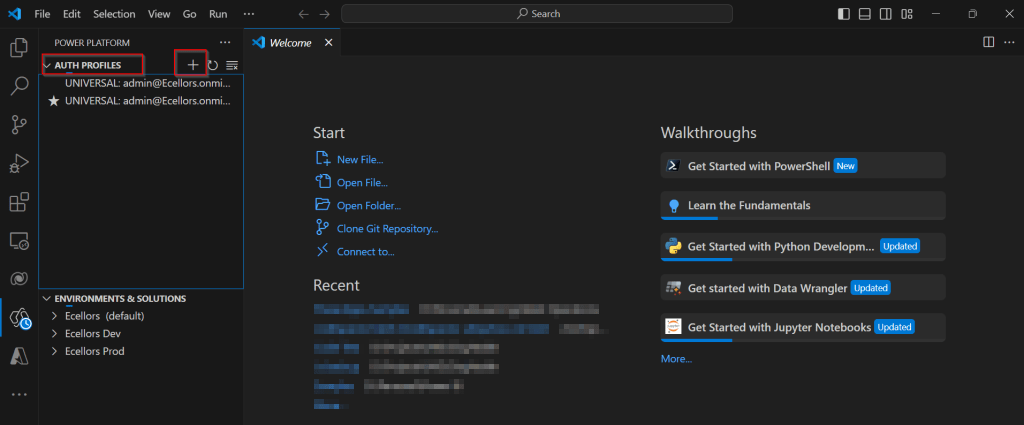
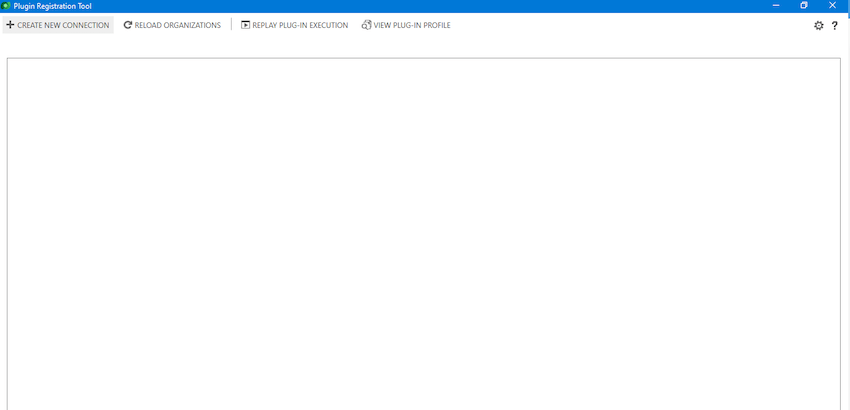
Now open up plugin registration tool
Click to create new connection
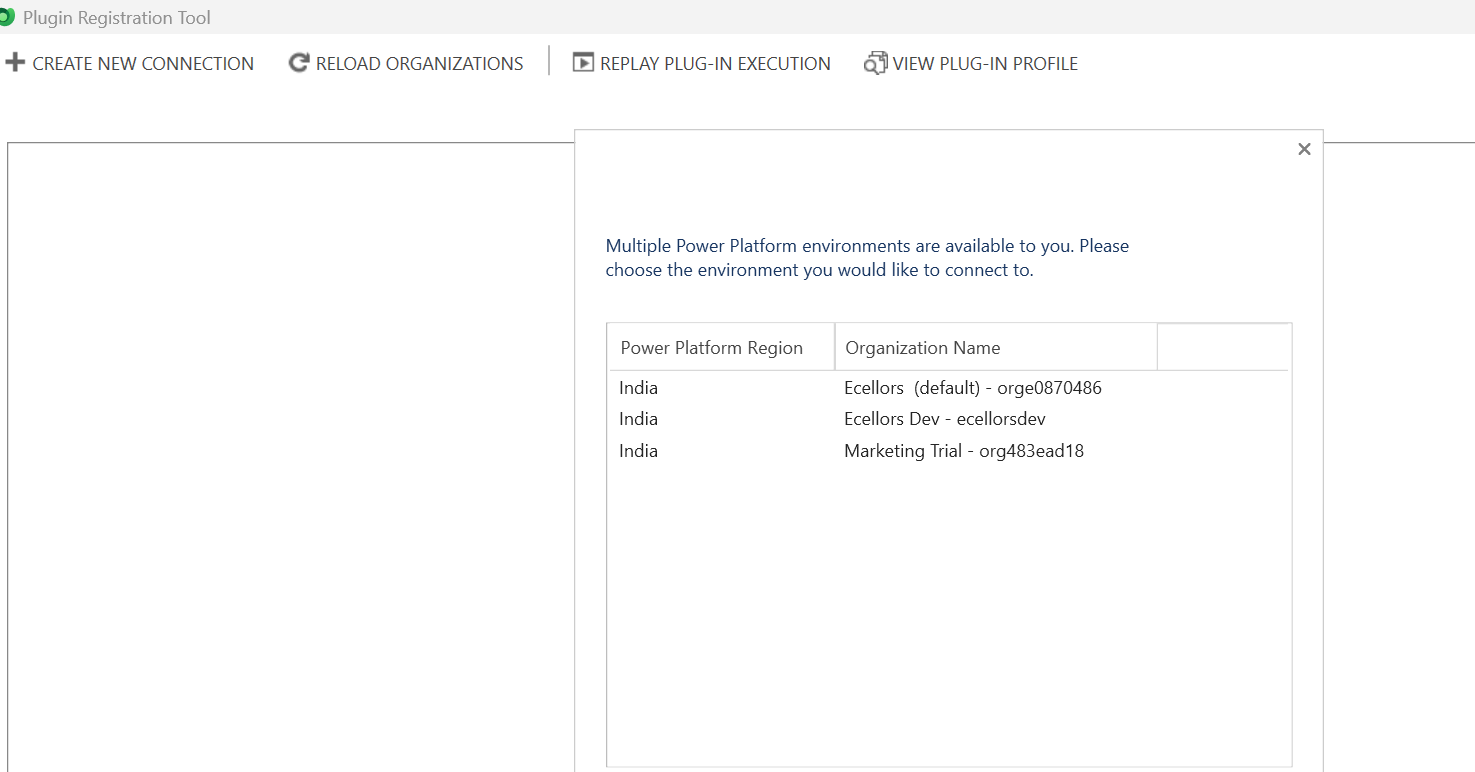
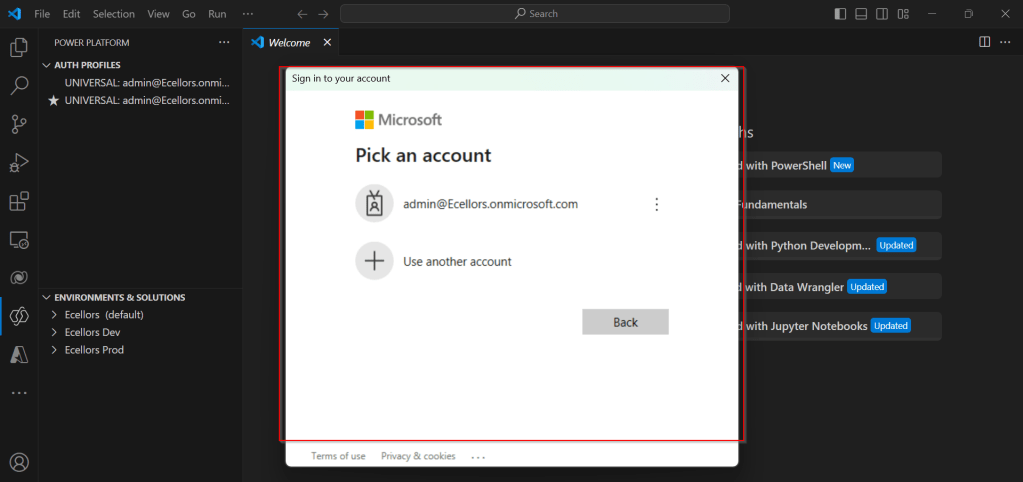
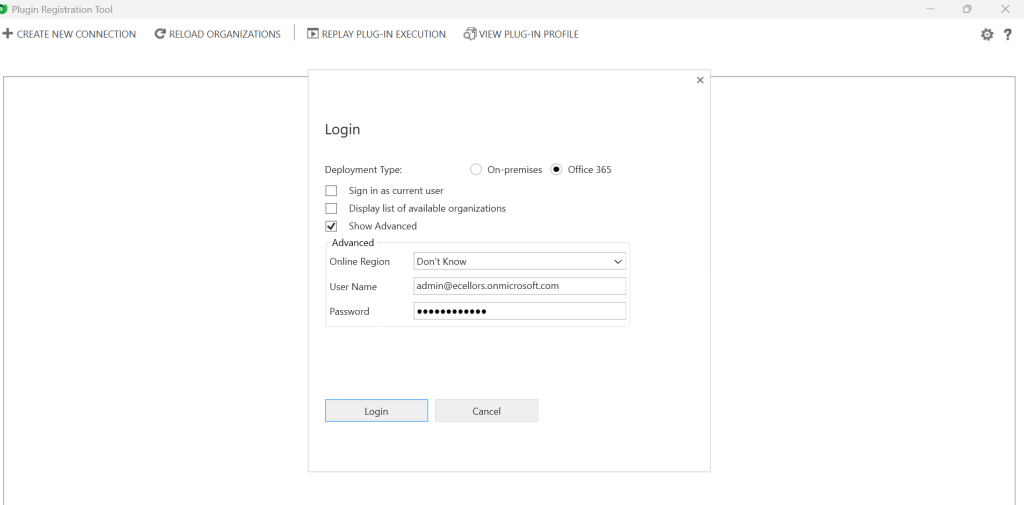
Provide login details and login
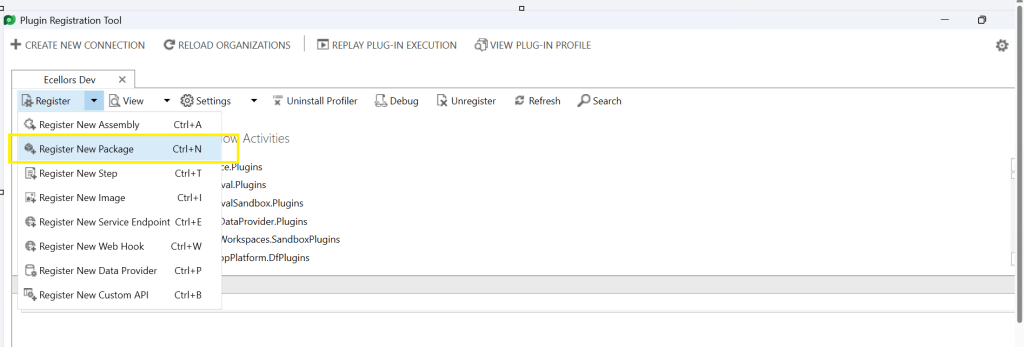
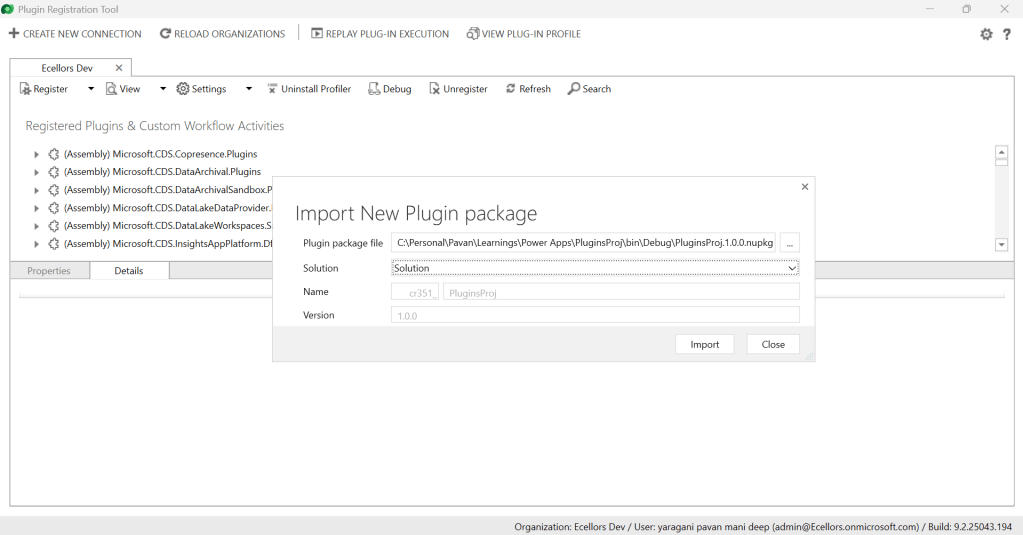
Click to Register New Package
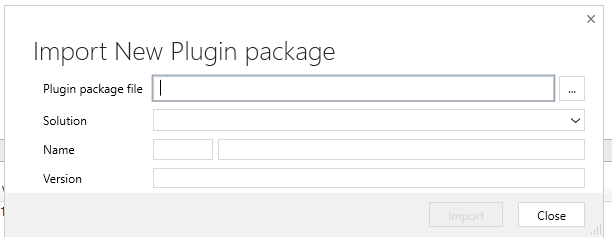
Browse to the directory where your nuget package file was created automatically when you build the project and import this file
Select the Command Data Service Default Solution and import it
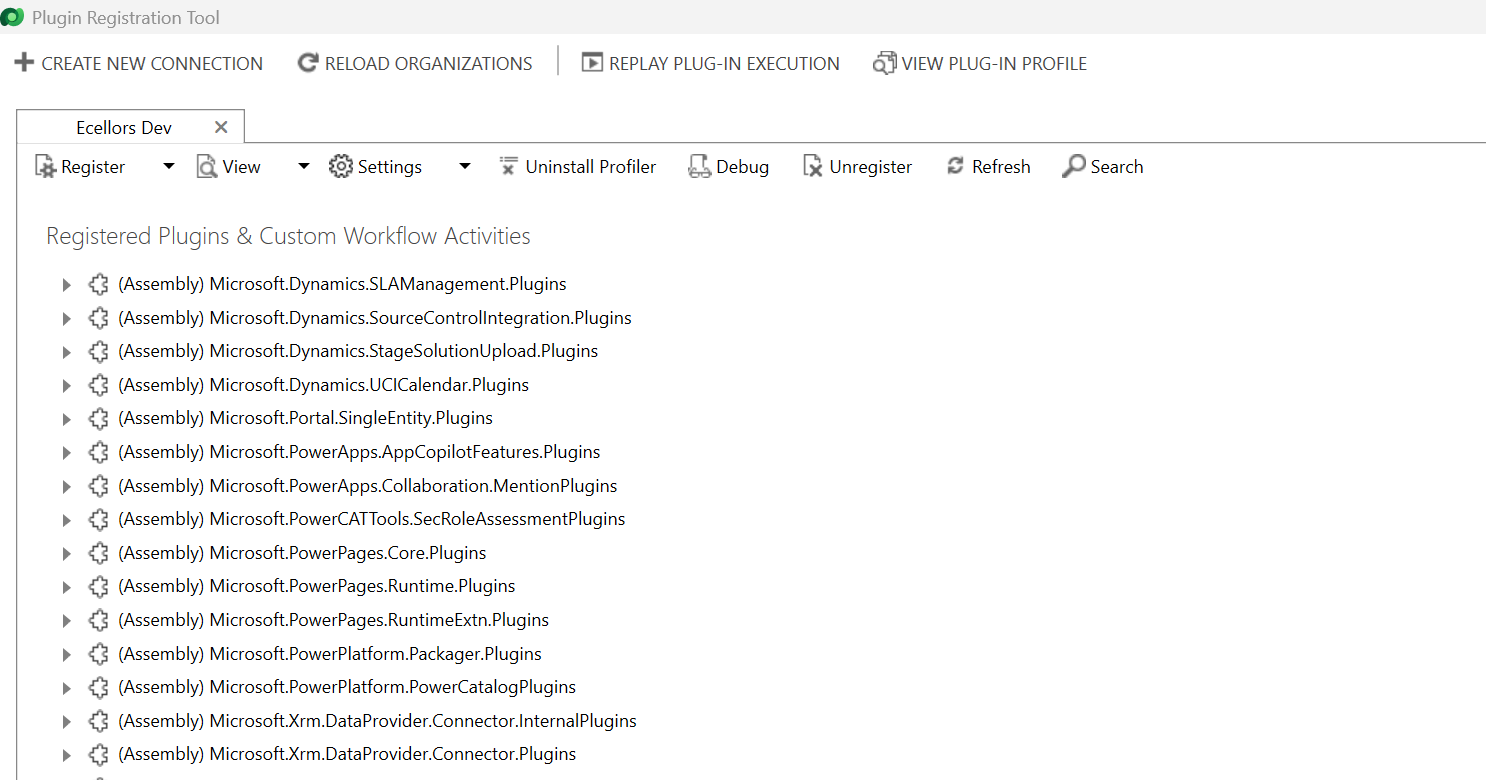
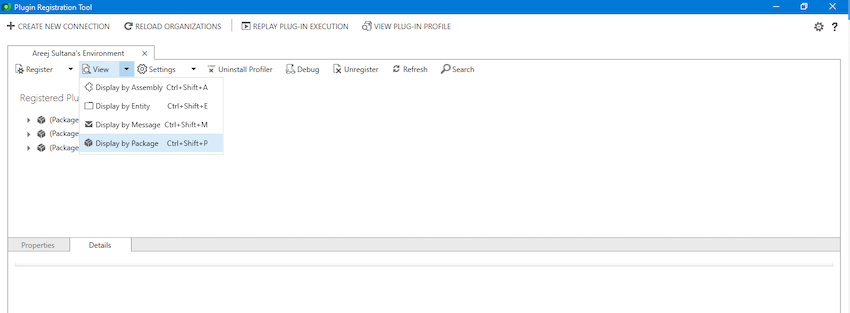
Click on view and Display by package
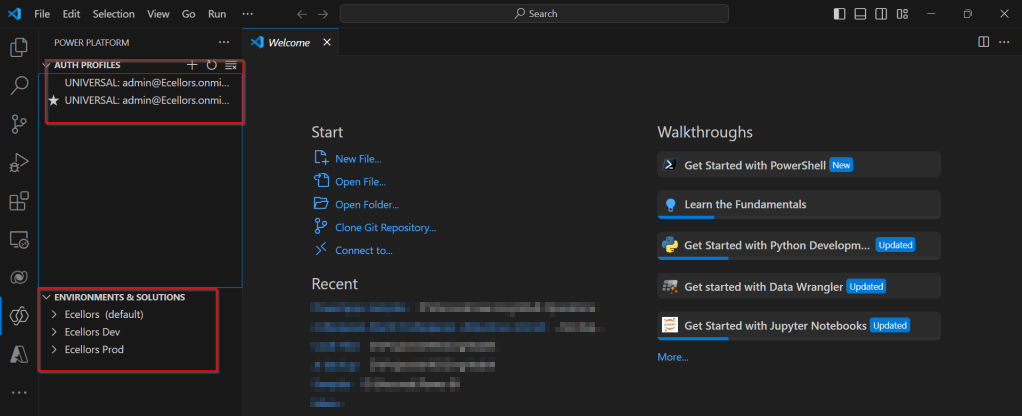
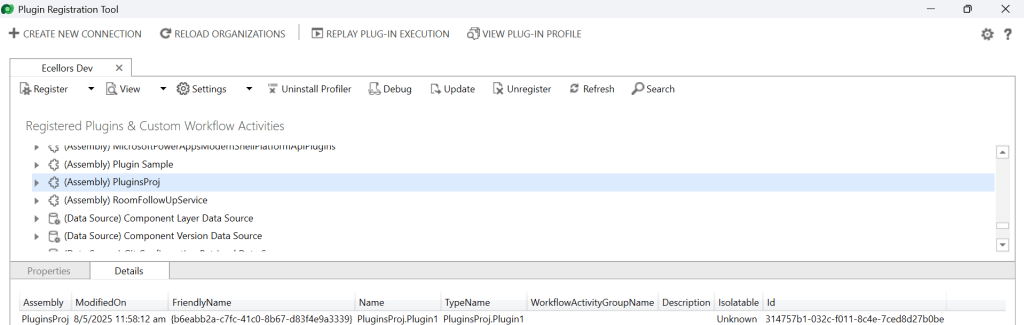
Now your Plugin Project is successfully registered with all dependent assemblies and ready to use.
While this post gives you a structure on how you can do build a plugin assembly, you can add the business logic as per your need.
Conclusion:
In conclusion, navigating the intricacies of Microsoft Dynamics 365 CRM plugins demands a nuanced approach, especially when dealing with NuGet Packages and dependent assemblies. This article has delved into the critical process of resolving the persistent ‘Could not load assemblies or its dependencies‘ issue, offering a comprehensive, step-by-step demonstration.
By following the recommended best practices, such as avoiding direct plugin project creation in Visual Studio and harnessing the power of Microsoft PowerApps CLI, developers can establish a standardized and reliable development environment. The CLI’s automatic creation of a NuGet Package file not only streamlines the process but also reduces the errors.
To further facilitate your journey, prerequisites such as downloading and installing essential tools like the Plugin Registration tool, Microsoft PowerApps CLI, and NuGet Package Explorer are highlighted. The guide emphasizes the significance of these tools in ensuring a smooth plugin development experience.
By adopting these practices and incorporating the suggested steps into your workflow, you not only troubleshoot existing issues but also fortify your understanding of the entire process. Take charge of your Dynamics 365 CRM plugin development, elevate your skills, and sidestep common pitfalls by mastering the art of handling NuGet Packages and dependencies seamlessly.
References:
Build and package plug-in code
Cheers,
PMDY