Exploring Power Platform and Beyond: Features, Experiences, Challenges, Solutions all in one place
Author: Pavan Mani Deep Y
Passionate for Power Platform. A technology geek who loves sharing the leanings, quick tips and new features on Dynamics 365 & related tools, technologies. An Azure IOT and Quantum Computing enthusiast...
Here is how you can enable TDS End Point in Dataverse…
Navigate to Power Platform Admin Center…https://admin.powerplatform.microsoft.com/home
Next navigate to the respective Environment to which you want to enable TDS End Point
Choose your respective environment, go to Settings
In the Settings windows, select the Product and then Features.
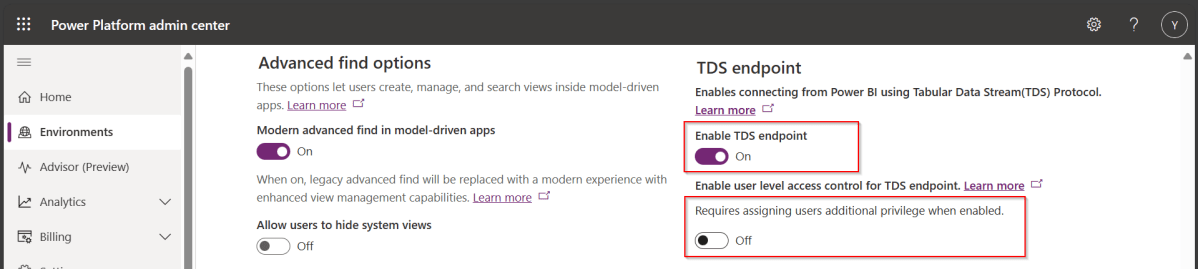
Scroll down to see TDS end point, just enable the TDS end point toggle button
Once this is enabled, you can also enable user level access for this TDS end point by configuring the security role as in the below step.
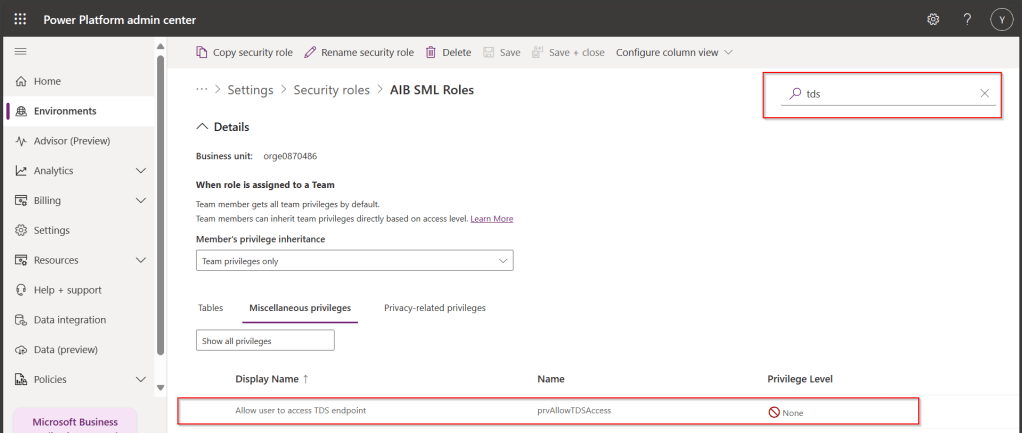
Open Security from Power Platform Admin Center and navigate to the available security roles, go to Miscellaneous privileges, search for tds, you can find a privilege to Allow user to access TDS endpoint.
Advantages:
With this TDS end point enabled, you can directly access the data in the Dataverse tables using SSMS(Preview) and in Power BI
While the interesting part here is that Dataverse security model will be applied to the data being viewed by the user.
That is whenever you were query the dataverse data using SSMS, the user role will be applied
In the same way, if the Power BI report is built using the TDS(SQL end point), any user who is going to access the report will be only seeing the data he/she can access based on current security roles in Dataverse
While this is a cool feature for anyone who is trying to build Dataverse security in Power BI without using row level security as this is a mystery till now.
Here is the use case, I was actually pulling data from Model Driven App. As I was testing my report and cross validating the counts with that of CRM, so, it is when I noted that the count of records getting mismatched exactly by the time zone difference and if you were any other time zone except UTC and using Date Diff functions, you may encounter this problem with Power BI which you should definitely handle.
The Power BI Service will be in UTC time zone. Actually, we can’t set the time zone neither in Power BI Desktop nor Power BI Service, we have to amend the time difference, that’s it.
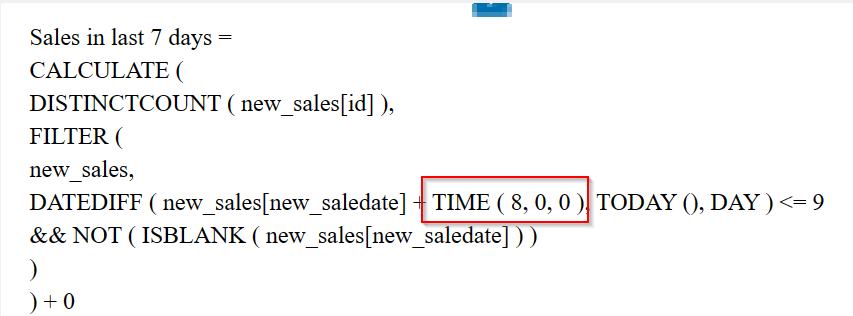
Consider you have a measure which calculates the date difference…consider adding the time zone difference to your DAX measures or using Power Query.
While here I am using the below DAX, I have adjusted here in DAX as below.
While I was in Singapore time zone (SGT), I have added UTC + 8 using the TIME Function available in Power BI and there you go…
Now the numbers should match exactly with that in your DataSource i.e. Power. Apps.
If you want to do this in Power Query based your scenario…you can follow the article in references.
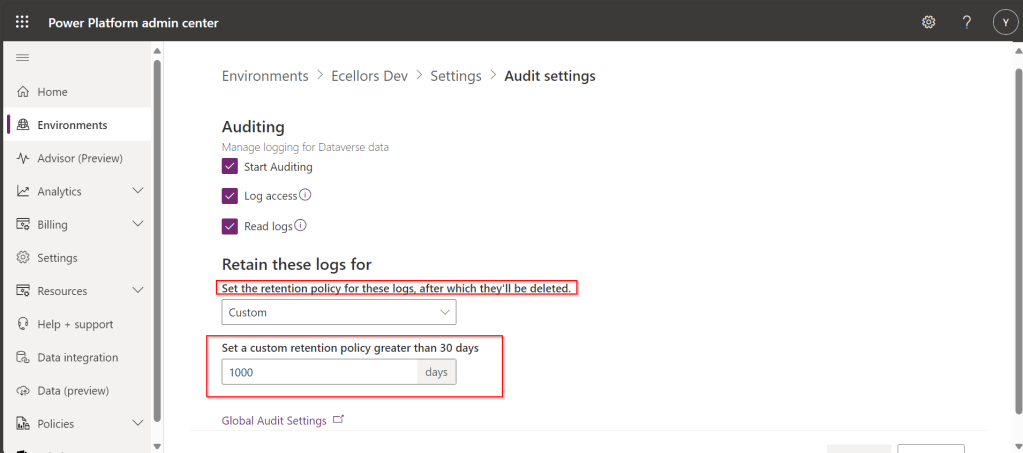
Do you know that you can set to auto delete the audit log information from Admin center. Yes, you can do this from Power Platform Admin center. Of course, this tip is a very small one, not knowing such feature can cost you so much time to figure out the Audit log deletion.
This post is all about embedding Python visuals in Power BI, you will need to install the respective dependent libraries like Seaborn, Matplotlibwhen you were creating visuals as we are using the respective libraries.
Thank you @Dr.S.Gomathi for sharing insights at GPPB Tamil Nadu, 2024, while I don’t know that Power BI has this capability. I am writing this down.
The first thing you need to do is to install Python, you can install the latest version from internet. Click here to Download Python for Windows.
Once downloaded and installed in your local machine, you can find a folder created under your Windows Start menu like below.
You need to right click on Python 3.11(64-bit) icon which is the current latest version and then click on open file location.
Then you will be able to see the contents in the folder
You need again right click on Python 3.11 (64 bit) and open its actual contents where the library files reside.
Copy this path, we need this in a while.
Now open Power BI Desktop and navigate to File –> Options and Settings –> Options
Now in the options and settings, you need to select on the Python scripting and specify the path which you just copied above as below.
Now you were ready to use Python visuals in Power BI.
Next step is to click on Python visual as highlighted below
You will be then asked to enable Python scripts as below
You will need to click on Enable as shown above. Once it is done, you are ready to start using Python visuals in Power BI.
Then you need to load data from your DataSource. Here is the link to the excel I have used. Once data is loaded into your Power BI report, you need to select respective data fields which you want to visualize. Here I am using two fields for X and Y axis, then in Power BI Desktop, you should be able to see something like below.
and in order to effectively visualize the sales trends, I will be visualizing the data using Violin Chart, which is using Seaborn library, while the Seaborn is actually based on Matplotlib library. So, I need to make sure I have those two libraries installed in my machine. You can install by using Command Prompt in your PC, you need to enter below commands and press enter to install.
pip install matplot lib
pip install seaborn
Once installed, we can plot using the below command in the python script tab in Power BI Desktop
This file contains hidden or bidirectional Unicode text that may be interpreted or compiled differently than what appears below. To review, open the file in an editor that reveals hidden Unicode characters.
Learn more about bidirectional Unicode characters
Then you may need to click on run script as highlighted below
This gives your Violin chart showing the sales distribution for different product categories in your Power BI Desktop. If you were facing any problems viewing the report, check the error in the pop-up message displayed by Power BI, you can also follow the Microsoft article on this mentioned in the references.
Hope this helps someone trying to use Python visuals inside Power BI. Same way, you can use different visualizations available with Python which were not available in Power BI by default.
Thank you for visiting my blog…in this post, we will see how we can create and manage a Power BI Environment variable in Model driven apps in Power Platform.
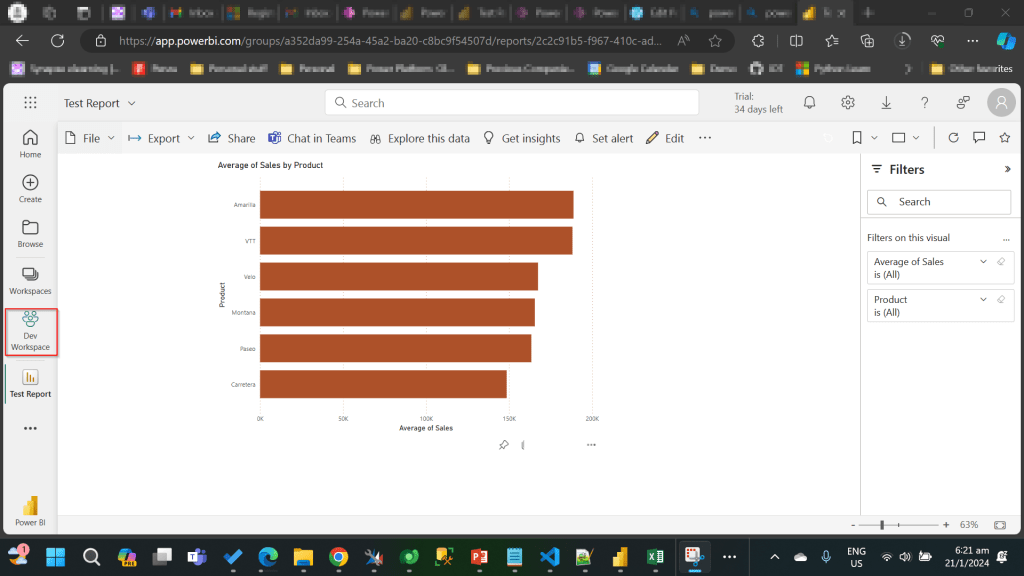
So, let’s say, we have two environments 1. Dev 2. Default, we want to deploy export the solution with Power BI report from Dev environment as managed solution and import that to Default environment. The report in Default environment should point to Production workspace in Power BI.
I have the following reports in workspaces.
Development workspace:
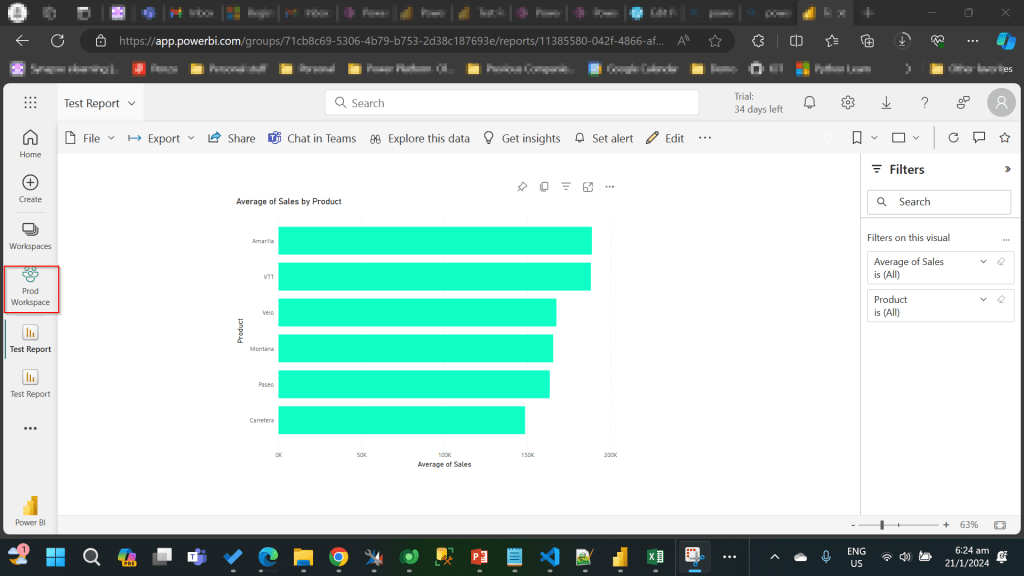
Production Workspace:
Now in order to deploy the report to Production, we need to use a managed solution and the report should point to Production workspace. So, in order to handle this, we will need to define an environment variable to store the workspace information. So, let’s get started.
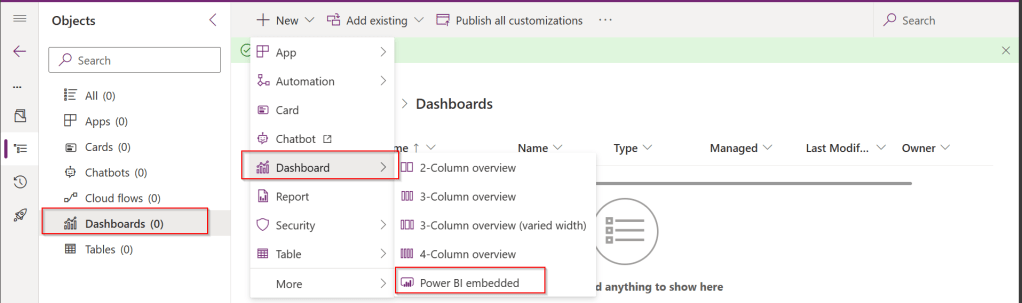
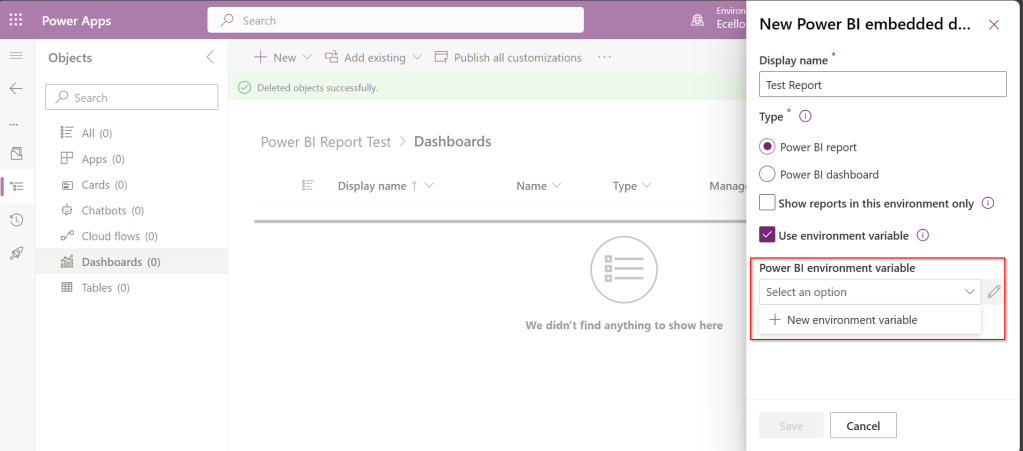
First, we will create a Power BI embedded report in Development environment.
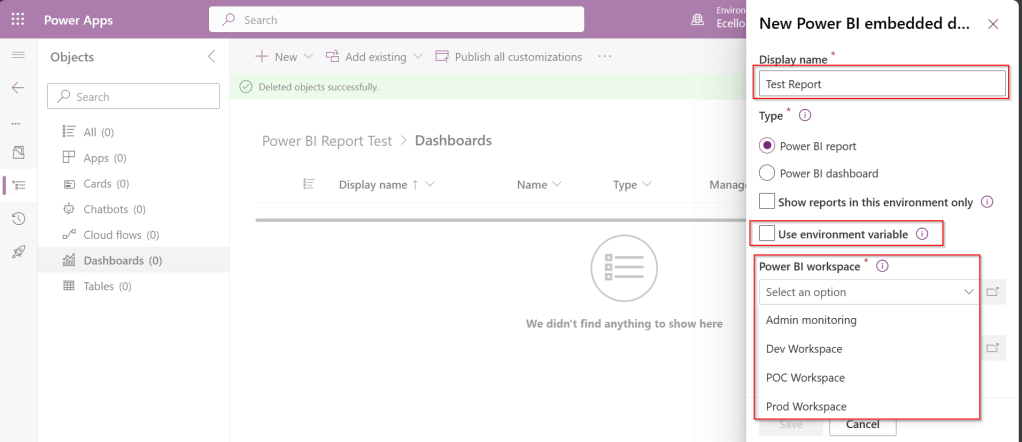
While you were creating a Power BI embedded report, you will be presented an option to choose from the Power BI workspace.
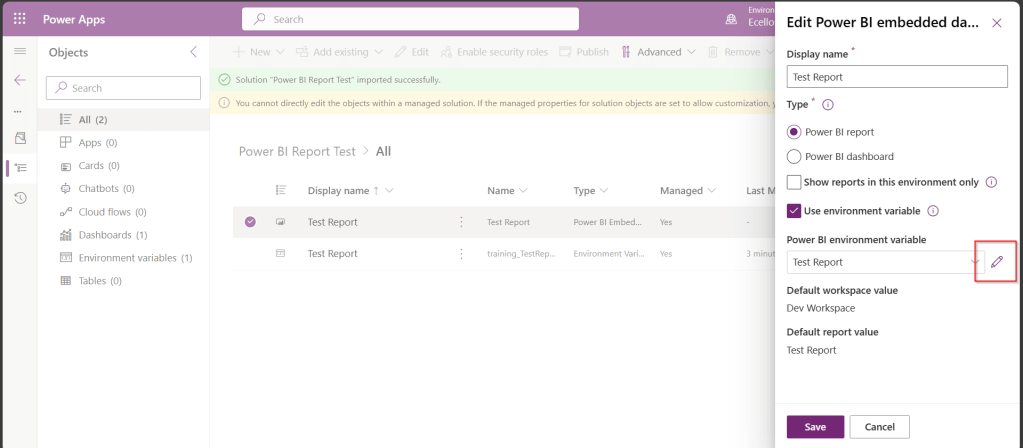
In order to achieve this requirement of deploying different versions of Power BI report in different instances, we need to use environment variable, so check the Use environment variable option.
The environment variable will be specific to this report and should be included in the solution when we want to deploy this report to higher environment.
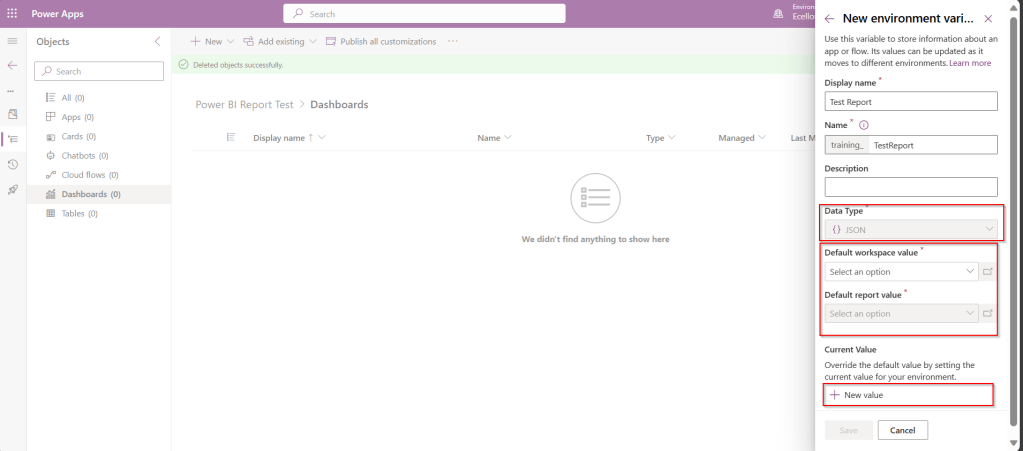
The next thing to note is that Default workspace would reflect the default value for this report and current value is required when we want to set to another report in a different environment.
In Development environment, we choose as below..
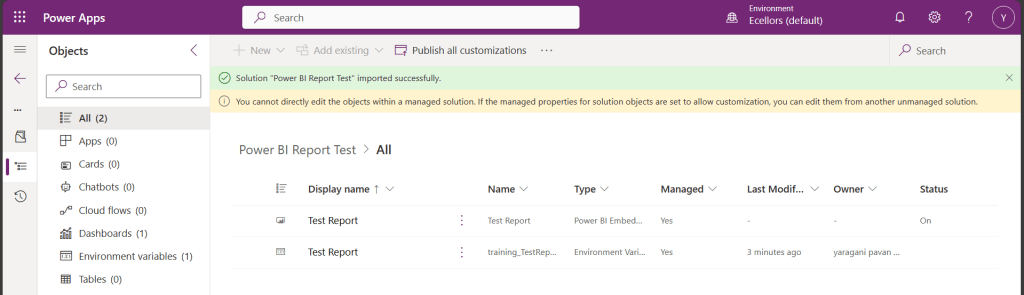
Once the environment variable is saved, we now have 1 Dashboard and 1 environment variable component in the solution.
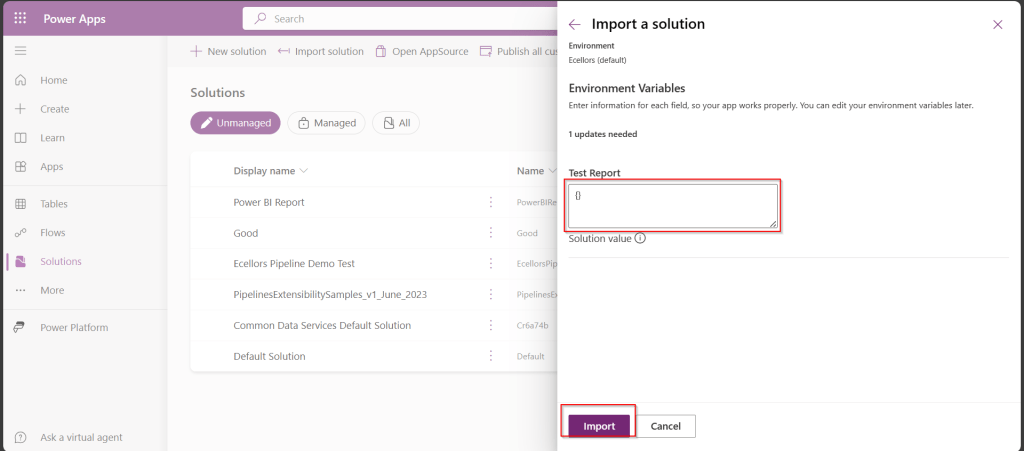
This solution is published and then exported as Managed solution, imported to another environment (Default environment which serves as Production environment here).
While importing, it asks to update environment variable, you can proceed to click on Import.
Now we have the solution in Default environment.
In order to update the value of the report to consider from Production environment, we need to open the report and click on the Pencil icon besides the Power BI Environment variable.
Then choose Prod workspace and its respective report and click save, publish.
That’s it…
You will be able to see two different reports in your Development and Default instances.
In this way, it is very easy to manage and deploy different versions of Power BI Report to different environments like Dev, Test, Prod.
Most of us know how to declare variables in our program…declaring a Var variable type is simplest one possible either in C#, Javascript or any scripting language.
Do you know that we can declare variables similarly in Canvas Apps using PowerFx…? A feature which was Generally available now..it’s none other than Named formulas.
With the named formulas, we can easily define and declare variables and only they were run when required, you don’t need to initialize it before hand, thus improving performance. Here you don’t even need to use Var while declaring the variable, you just name it…Also it offers below advantages.
The formula’s value is always available. There is no timing dependency, no App.OnStart that must run first before the value is set, no time in which the formula’s value is incorrect. Named formulas can refer to each other in any order, so long as they don’t create a circular reference. They can be calculated in parallel.
The formula’s value is always up to date. The formula can perform a calculation that is dependent on control properties or database records, and as they change, the formula’s value automatically updates. You don’t need to manually update the value as you do with a variable.
The formula’s definition is immutable. The definition in App.Formulas is the single source of truth and the value can’t be changed somewhere else in the app. With variables, it is possible that some code unexpectedly changes a value, but this is not possible with named formulas. That doesn’t mean a formula’s value needs to be static – it can change – but only if dependencies change.
The formula’s calculation can be deferred. Because its value it immutable, it can always be calculated when needed, which means it need not actually be calculated until it is actually needed. If the value is never used, the formula need never be calculated. Formula values that aren’t used until screen2 of an app is displayed need not be calculated until screen screen2 is visible. This can dramatically improve app load time and declarative in nature.
Named formulas is an Excel concept. Power Fx leverages Excel concepts where possible since so many people know Excel well.
Tip: Use App.Formulas instead of App.OnStart
The best way to reduce loading time for both Power Apps Studio and your app is to replace variable and collection initialization in App.OnStart with named formulas in App.Formulas.
Example without Named Formulas:
This file contains hidden or bidirectional Unicode text that may be interpreted or compiled differently than what appears below. To review, open the file in an editor that reveals hidden Unicode characters.
Learn more about bidirectional Unicode characters
This file contains hidden or bidirectional Unicode text that may be interpreted or compiled differently than what appears below. To review, open the file in an editor that reveals hidden Unicode characters.
Learn more about bidirectional Unicode characters
This blog post deals about what you need to do for your client applications in specific to use Dataverse Client API instead of existing CrmServiceClient(Core Assemblies) API.
Below were 3 reasons cited by Microsoft and why we need to just be aware of this move.
1.Cross Platform Application Support: With the introduction of Microsoft.PowerPlatform.Dataverse.Client, the new Dataverse Service Client supports Cross Platform Support.
3. Performance and functional benefits: We can have one authentication handler per web service connection instead of just one per process. The Dataverse Service Client class supports a smaller interface surface, inline authentication by instance, and Microsoft.Extensions.Logging.ILogger.
What’s the impact?
Plug-ins or custom workflow activities – no changes
New or existing online applications – changes are needed but not immediately…
On-premises applications – this article is not for you, yet
So, meaning it impacts Online Client applications only. While you really don’t need to worry much about this the class member signatures of ServiceClient and CrmServiceClient are the same, except for the class names themselves being slightly different. Application code should not need any significant changes.
As of now, no changes to your code are required, but it is better to keep in mind that in the future the CRM 2011 Service End Point would be deprecated, and this change would be made mandatory.
So, what should you do to incorporate this change?
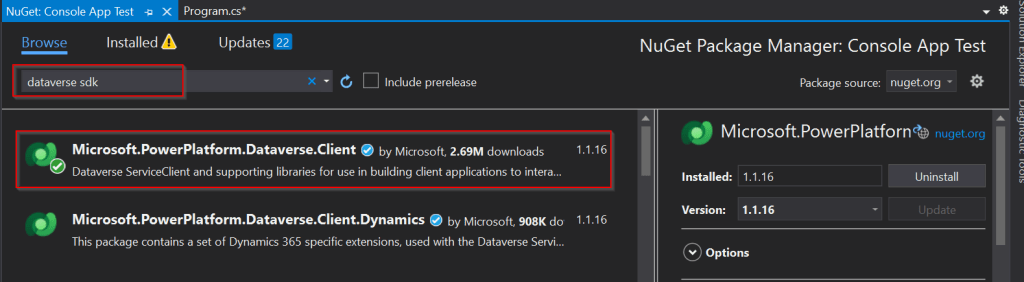
Use the following assemblies from Nuget instead of CrmSdk.CoreAssemblies
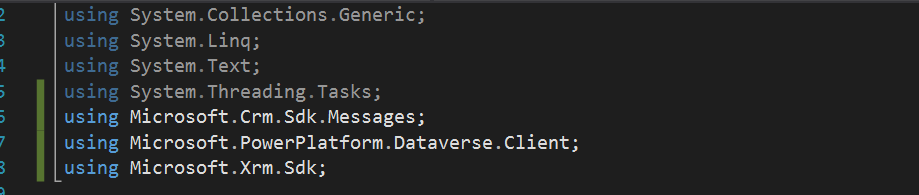
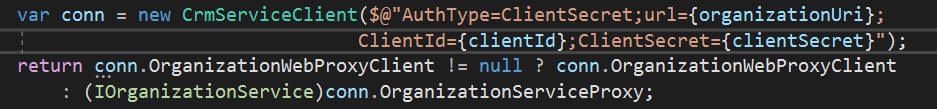
Add the below using statement to use Microsoft.PowerPlatform.Dataverse.Client
Use ServiceClient instead of CrmServiceClient, ServiceClient would return your OrganizationService.
I got a requirement do develop integration between Dynamics 365 and 3rd party data warehouse. Here I have to use SSIS for Integration. Obviously when you want to write data to Dynamics from SSIS, we need to use Kingswaysoft SSIS Components. So, I have retrieved the data from the files coming from 3rd party warehouse and writing the data in to Dynamics using Kingswaysoft Destination component.
During the implementation, I had to create a new entity in Dynamics 365 CE as below and configure it in Kingswaysoft adapter.
But I was unable to select the newly created entity in Destination Entity inside the destination component editor as below. I tried refreshing metadata, rebuild the solution, closed visual studio multiple times, cleared the cache but none of them helped. As shown below. I was not able to select the respective newly created entity.
I was unable to get that even after 2 days…I tried to create another package and set the Kingswaysoft SSIS Destination editor, so here I am able to see the newly created entity. There comes the fix.
So here are the two ways how you can do it using the same SSIS Package itself without using another.
Step: If your connection manager uses SOAP 2011 (Dynamics 365 CE, Dataverse, CRM 2016, 2015, 2013, 2011) …then you can create one more connection with the same configuration.
Then you should see something like below in your connection manager’s section.
Just delete the old connection and rename the new connection to old connection manager name and update the lost references at all places in your package.
2. Step: Change your service end point to Web API as highlighted below
Just update any missing references…that’s it….
Thank you for reading…if you have any issue on the same, please let me know..
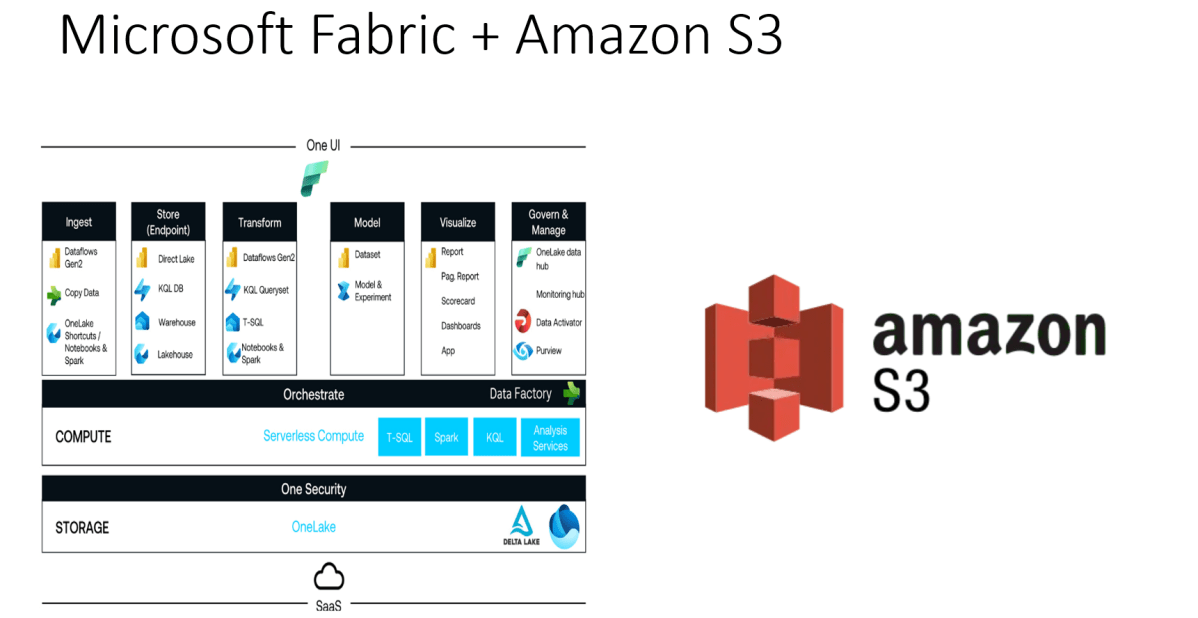
Did you ever try out the features released with Microsoft Fabric during Ignite 2023. So here is my first YouTube video on how you can use the features in Microsoft Fabric to show a Power BI report out of CSV File in AWS S3 bucket.
Earlier when you want to achieve such requirement, you would need to write Python script in Power BI Desktop to show anything from AWS S3 bucket in Power BI. Also, tons of new features included ex. One Lake Data Hub and also brought Data Engineering, Data Science, Data Warehouse, Real Time Analytics under one umbrella so it paved way for building great Data Projects especially Big Data.
So, I would definitely recommend you check out the features…all you need is just register for a free Fabric Trial, that’s it, you can use these 60 days. This is more than enough to try out. You can find the link on the Fabric page itself, however I am not sure if this is only for a limited period of time. Don’t waste this.
If you want to learn about these features, don’t forget to check the Microsoft Learn and complete the Fabric Challege here. I hope you would definitely love them.