In today’s no code world and AI, while most of the Apps are developed using low code approach, sometimes we have to go with the traditional way of development to handle any integrations with other systems.
When we give anyone Command Line script and ask them to execute, the other person would immediately open Search bar at the bottom available in Windows and start entering cmd. Immediately command prompt window appears and will be able to execute the same command.
But what if we ask to execute command line Commands from C# code…? So, in this blog post, I will show you how easily you can call command line commands with a simple example. Let’s get started…
Here in order to showcase, I will just use a basic command line command and run it from C#.
Everyone knows how to find the ipconfig command right, which just shows the internet protocol configuration when entered in command line like below.
In order to execute it from Console Application using C#, we would need to utilize the System. Diagnostics. You can utilize the below C# code.
This file contains hidden or bidirectional Unicode text that may be interpreted or compiled differently than what appears below. To review, open the file in an editor that reveals hidden Unicode characters.
Learn more about bidirectional Unicode characters
When we execute this command, it shows exactly same as what we saw above with Command Line.
In the same way we can call any Command Line Commands from C#. I have to use this approach for my Power Platform Implementation integration to decrypt encrypted messages using PGP and I found it to be very helpful and thought of sharing with all of you. If you were looking for a program to decrypt, you can check out for previous blog post here.
Are you debugging the Dynamics 365 Plugins using Plugin Profiler, did you ever notice this problem that you were unable to persist profile so as to debug your plugin. Did you got frustrated as you couldn’t capture the profile even after lot of tries installing and uninstalling the profiler. Just read on. I am writing this blog post after fixing a similar situation with one of my Plugin.
First of all, I would advise you to check the below.
Plugin trace log under Settings –> Plugin Trace Log.
Check if your Plugin is being called multiple number of times
Check the filtering attributes of your Plugin whether it is causing to go in an infinite loop
Suppose if you have added an image, did you select the respective attributes of the image
Did you add sufficient depth conditions to prevent infinite loop executions.
At what step is your plugin running, is it in PreOperation, PostOperation.? In case you were throwing an error, change it to Prevalidation step and check.
Were you using persist to entity option while debugging, try changing to throw an error and see.
If you note that the system becomes unresponsive and you were not able to download the log file, then definitely your logic is getting called multiple times. Please reverify.
Once you have verified these, you should be able to find out the exact root cause of the issue…I will leave to yourself.
I am a big fan of Power Automate…but this post is not about flows but features about Custom Workflow in Dynamics 365 CE.
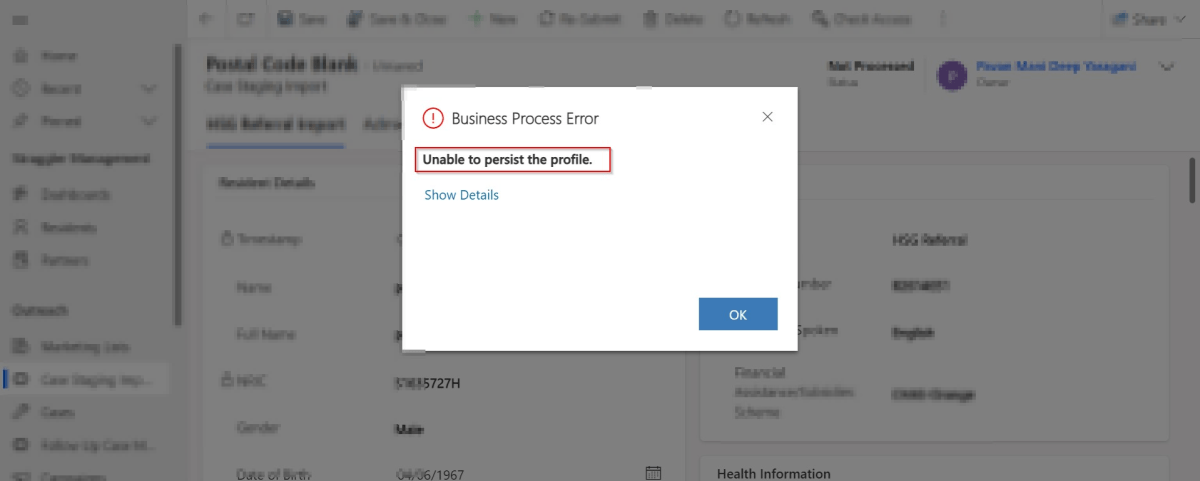
Did you ever come across this problem where you were not able to debug custom workflow extension. I had come across this and this blog post is all about it…I successfully registered my Custom workflow, but it is not triggering at all.
So, I need to debug it to see what the exact issue was…as I am encounter this error.
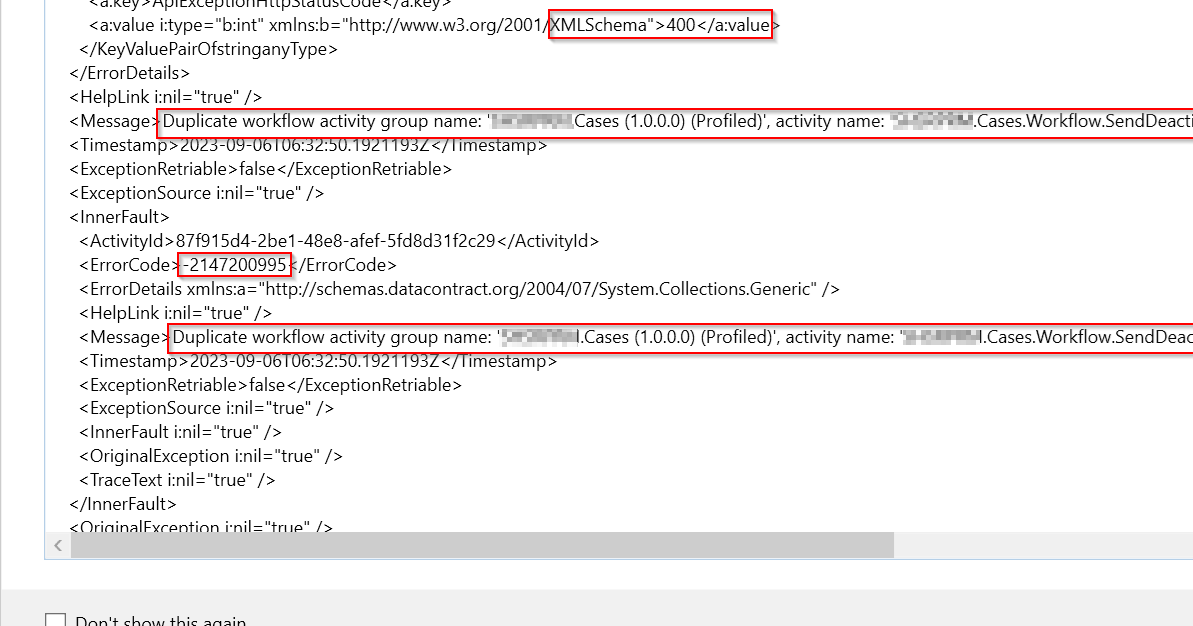
Error message says Duplicate workflow activity group name: ‘EcellorsDemo.Cases(1.0.0.0) (Profiled)‘. So, I tried to check my code, plugin steps and any activated plugins but couldn’t find any duplicates.
Usually while debugging your custom workflow using profiler, your workflow will go into draft mode and another copy of the same workflow gets created with name of (Profiled) attached to the name. However, in my case, I didn’t see the same behavior and at the same time, I was unable to use Profiler after the first profiling session and it gave me error shown above.
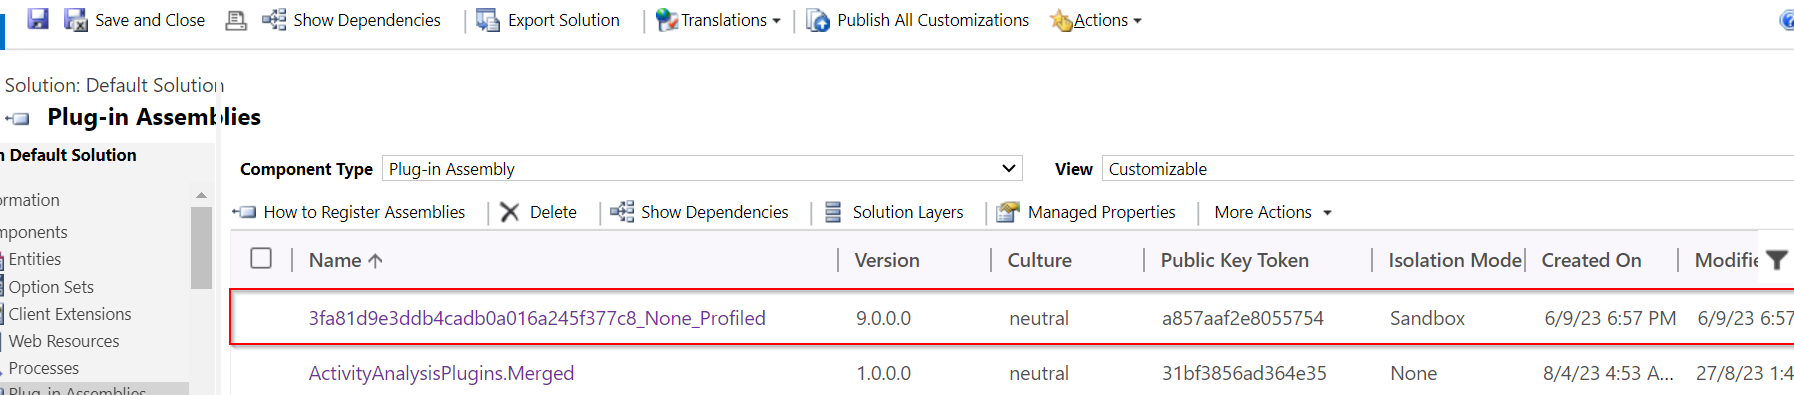
In order to resolve, this just delete the Plugin Assemblies which could find in the default solution like highlighted below…
Once you have deleted this, try to debug the custom workflow and voila!!!
Hope this helps someone troubleshooting Custom workflow…!
This post is for all who are working on D365 Model Driven Apps and mainly Plugins.
Yes, you saw it right, in this blog post, we will see how can debug plugin without using our favorite plugin profiler which is very widely used from quite some time by everyone working on Plugins for Dynamics 365. All this is done by a tool called Dataverse Browser, which is not yet on XrmToolBox. Please note that there were some limitations as detailed in limitation section below.
Here are 3 simple steps to follow..
Install Dataverse Browser
Attach the Debugger
Run your actual operation.
Step into your code and debug it.
The tool embeds a web browser based on Chromium. It works by translating the Web API requests to SDK requests. Then it analyzes if plugin steps are registered on the message and it loads them, make them run locally. All other requests are sent to the Dataverse, so that the plugins are interacting with the real database.
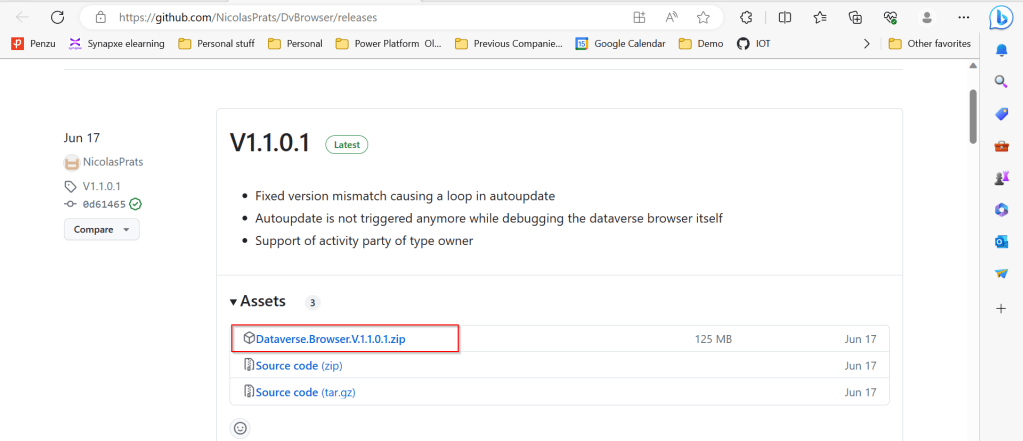
Download the latest source code of Dataverse browser here.
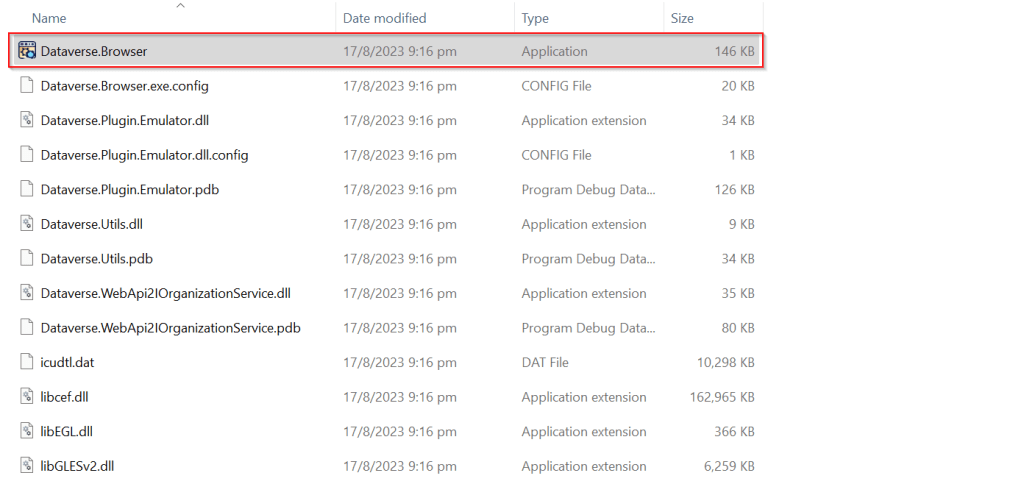
Next extract the zip file downloaded as highlighted below
Extract the zip file downloaded, open Dataverse.Browser Application as highlighted below.
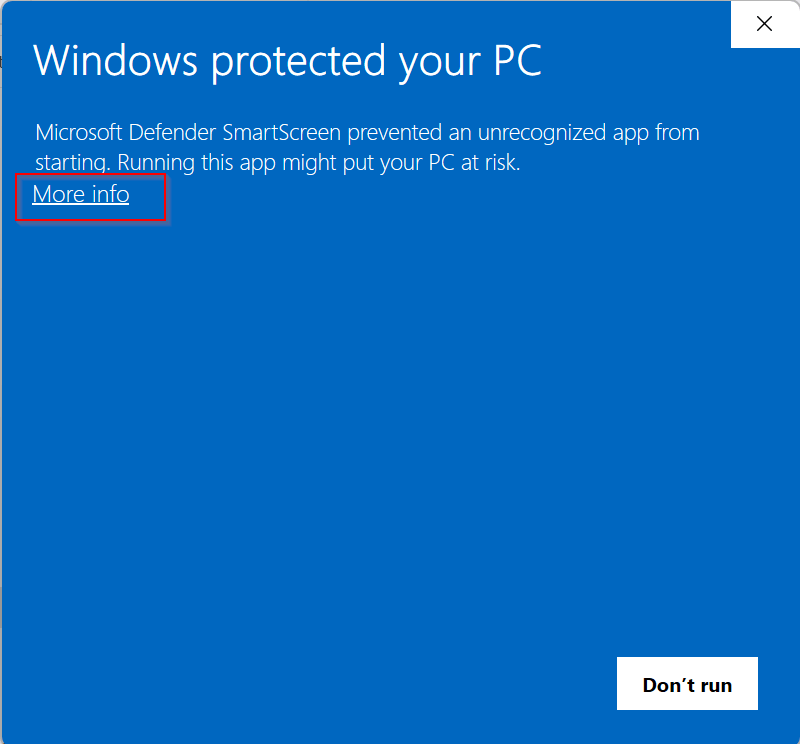
In the popup window, click on More info as highlighted below…
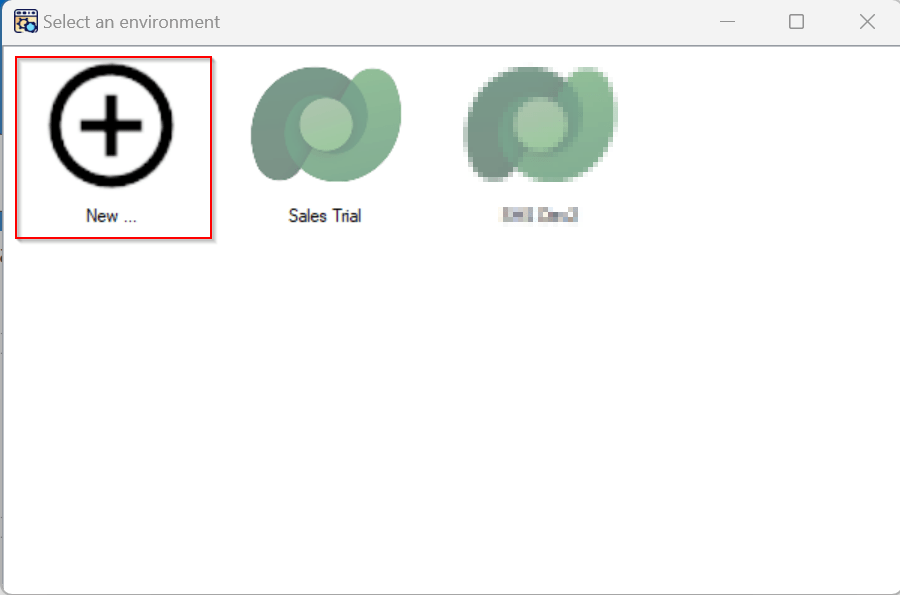
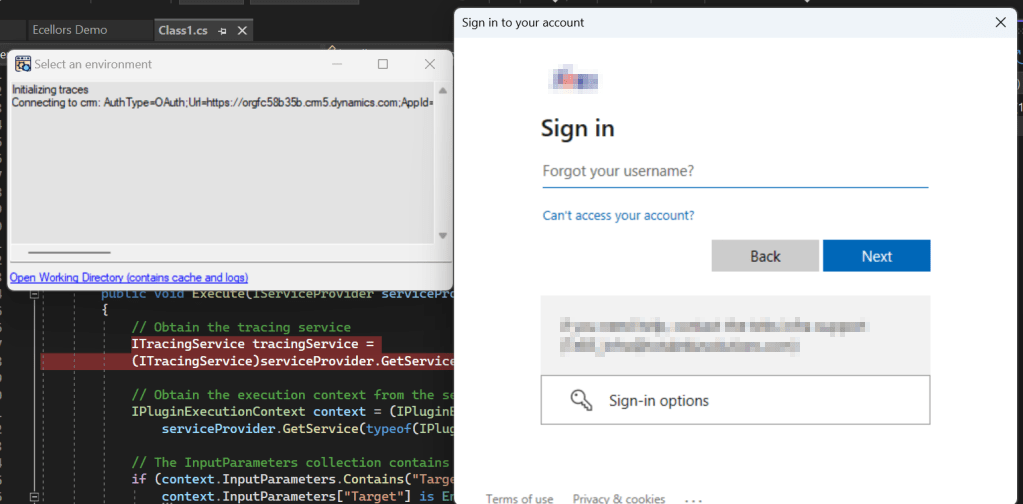
Then run the application anyway…you will be presented with a window where you can select the environment. Going forward, any time you want to open Dataverse browser, just open the Dataverse.Browser.exe and choose the environment as below.
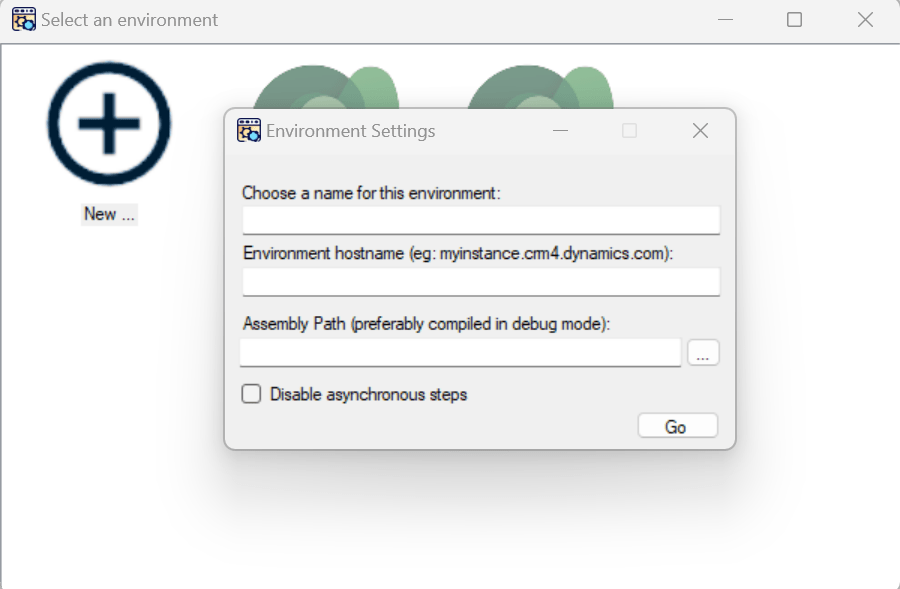
Click on New, enter the details as above and key in the details.
Enter the settings of your environment:
A name meaningful for you
The host name of your instance (without the https://)
The path to the plugins assembly file (the dll). For a better experience, it should be compiled in debug mode with the pdb file generated.
Then click Go.
You just need to Authenticate to your instance.
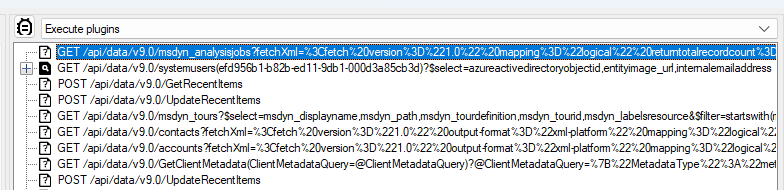
Once Authenticated to the respective model driven apps, all the Web API requests sent to Dataverse will be shown as below.
I have following Plugin Libraries registered.
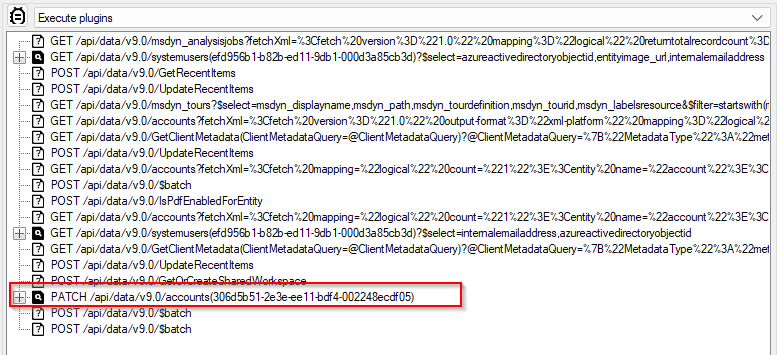
Next step is to choose the instance and perform the respective operation which triggers the Plugin. So, in here, I will perform an update to the Account entity from the Dataverse Browser which triggers the Plugin.
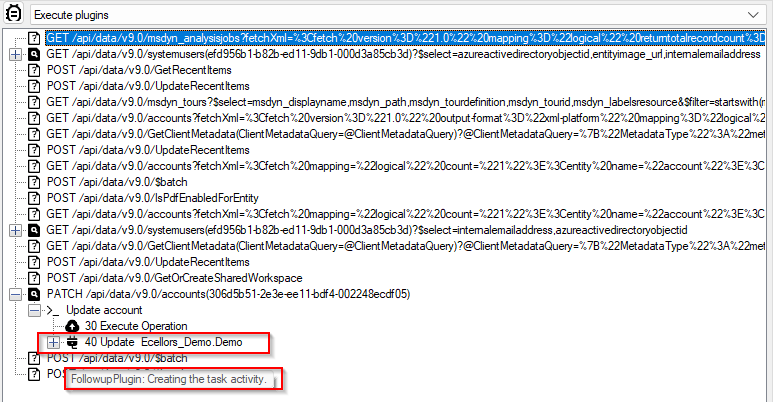
Once an update is performed, a Web API request gets recorded in the Dataverse browser as highlighted below.
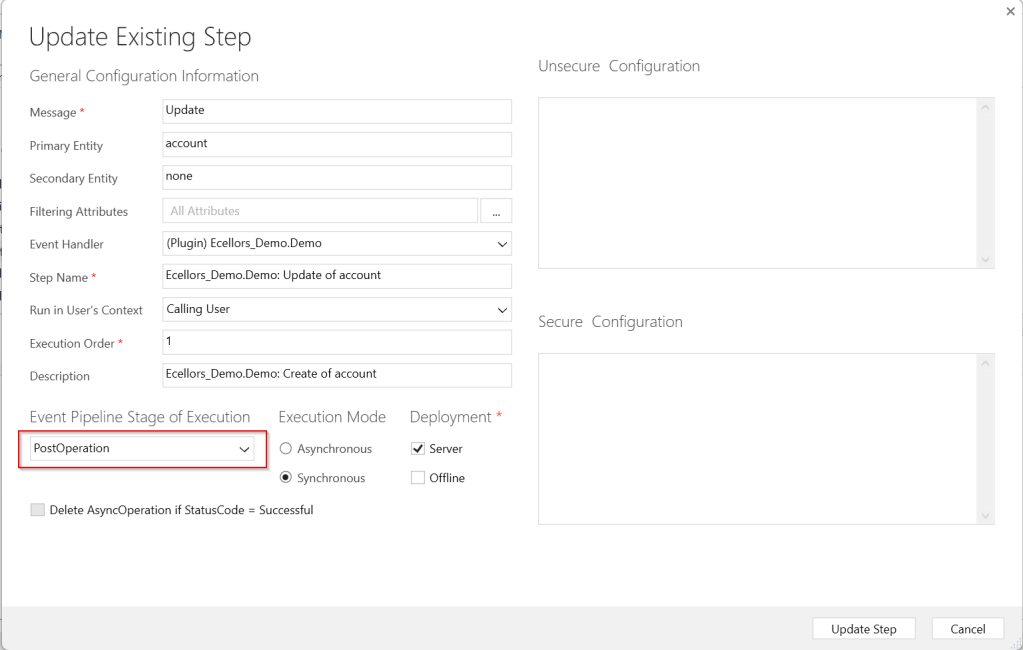
Since the Plugin is in Post Operation, i.e. Stage number is 40
Just expand the Patch Request, you should see two operations on 30, 40, but area of interest here is for the Plugin which was registered on stage 40.
Make sure you open the Visual Studio and perform the below steps from Dataverse Browser.
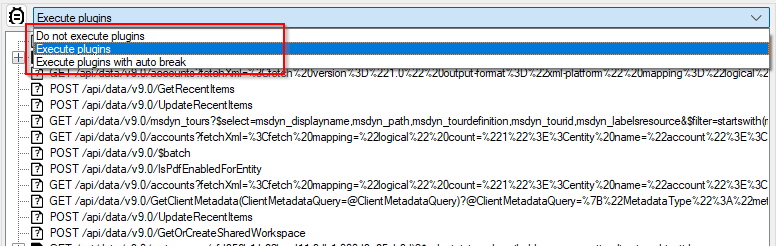
Attach the debugger from Dataverse Browser by clicking on the Plug Symbol as below which will show the list of debugger options available for you to select from. Here I have selected Execute Plugins, plugin will be invoked. You can either select any of the three options as presented below.
1.Do not execute plugins – recommended when you want to debug without actually triggering your plugin logic. i.e. With this approach even you can check the code in Production environment.
2. Execute plugins/Execute plugins with auto break – recommended when you want to debug by triggering your actual plugin, this is recommended in case your plugin code had changed recently and in Development environments.
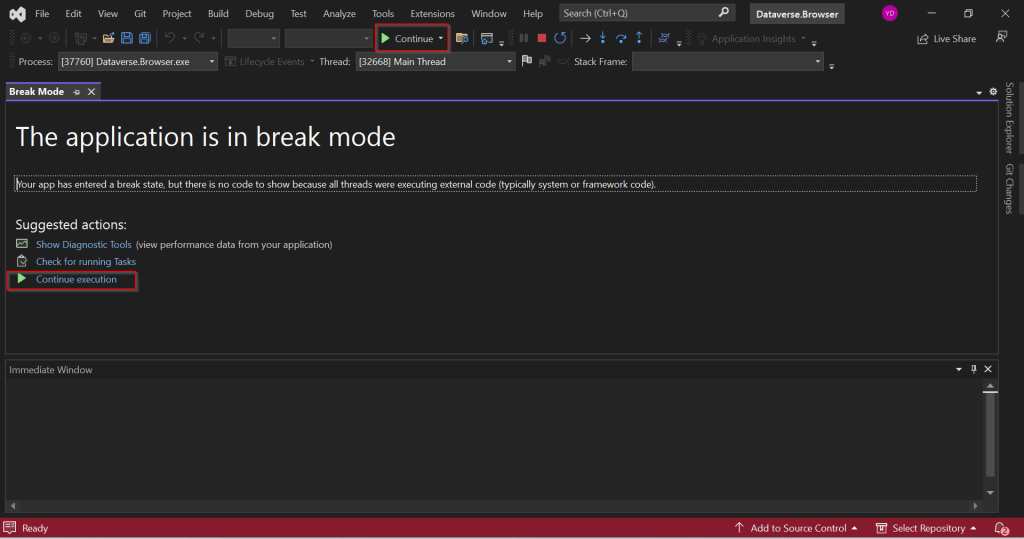
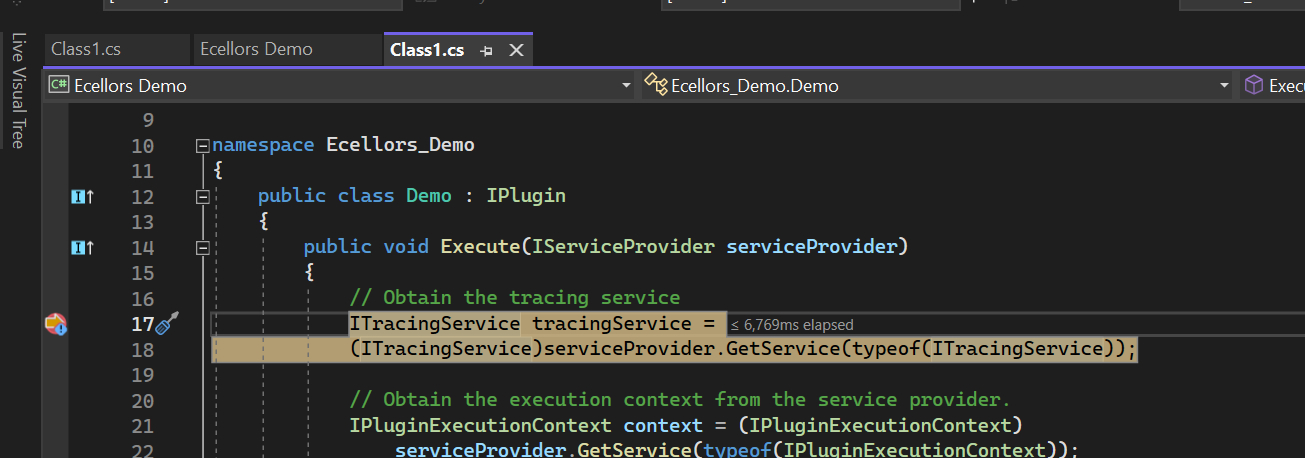
Just select Ecellors Demo – Microsoft Visual Studio: Visual Studio Professional 2022 version which will launch an existing Visual studio 2022 as below in break mode. Next click on Continue as highlighted below or press Click F5 on your keyboard.
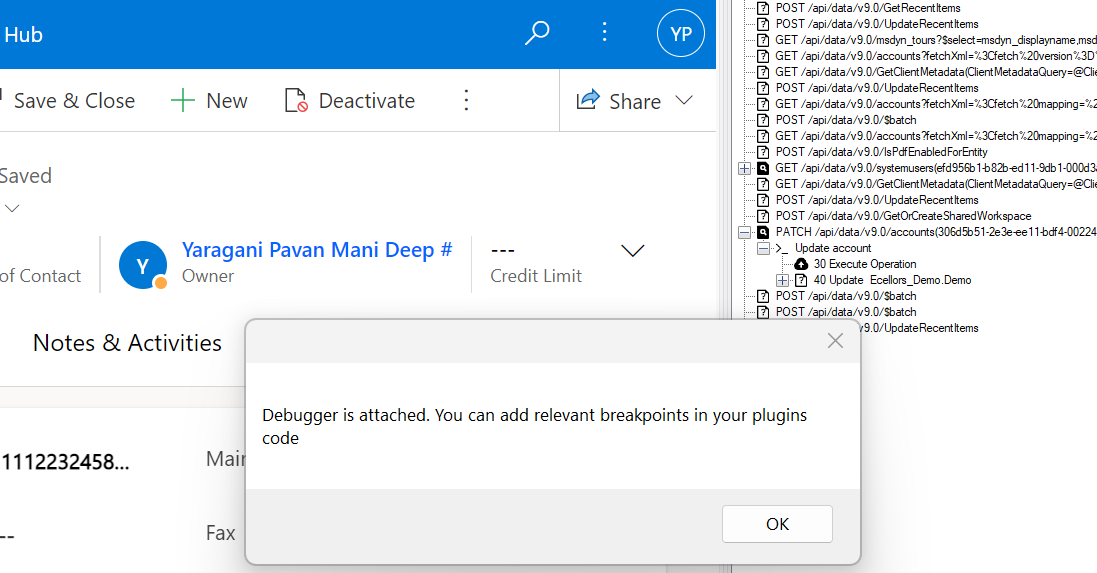
This shows you that the debugger has been attached when you navigate to Dataverse Browser asking you to place your breakpoints.
Now just place breakpoints in your code in Visual Studio. Just go back to Dataverse Browser and click on Ok on the Diaglog box.
Perform the operation which triggers the Plugin from Dataverse Browser itself, this will hit the break point in Visual Studio from where you can debug your plugin.
As you might have observed, your code need not throw exception in order to debug, you could do similarly to the way you would debug using Profiler. But here just that you don’t need to deploy the latest code to the Dataverse just for debugging purpose.
This gives a lot more flexibility eases the way you debug plugins.
Limitions:
There is no support for transactions.
When plugins are triggered because of a server-side operation, they will not be run locally.
For many reasons, behavior will never be perfectly similar to the one when plugins are executed on server side.
Happy debugging, I hope you found this post useful…