Are you a Power Platform or Dynamics 365 CE Developer, you would definitely need to work on Plugin Registration tool at any given point of time and having a local application for Plugin Registration tool greatly helps…in this post, I will show a little different way to install Plugin registration tool and that too very easily.
Well, this approach is especially useful to me when I got a new laptop and need to work on Plugin Registration Tool where the Plugins already build for the implementation.
First 3 ways might have known to everyone through which you can download Plugin registration tool…do you know there is fourth approach as well…
Because there were limitations to use these approaches at least in my experience, I found the fourth one very useful.
XrmToolBox – Not quite convenient to profile and debug your plugins
https://xrm.tools/SDK – Dlls in the downloaded folder will be blocked and would need to manually unblock the DLL’s for the Tool to work properly
CLI – People rarely use this.
Just do note that the approach is very easy and works only if you have a Plugin Project already. Please follow the steps below
Just open the Plugin project.
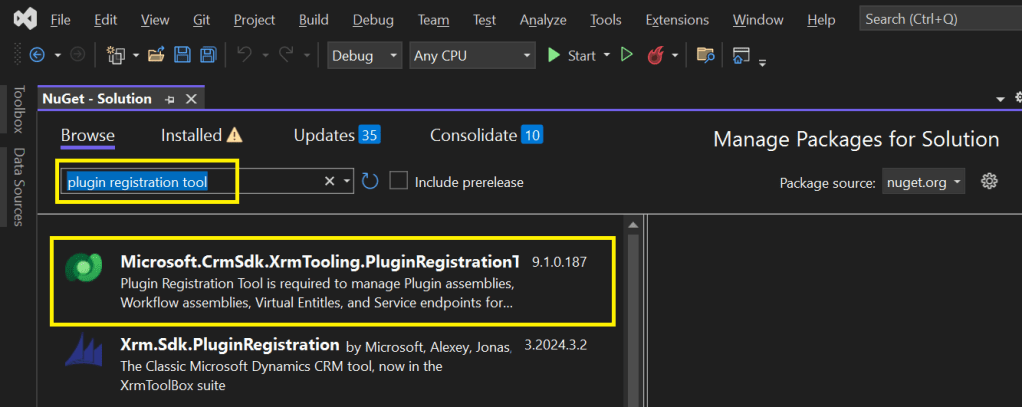
Right click on the solution and choose manage Nuget Packages for the solution
Search for Plugin Registration tool as below
4. Choose the Plugin project and click install, confirm the prompt and agree the license agreement shown
5. Once installed, next go to the Project folder in the local machine.
6. Navigate to Packages folder, you should see a folder for Plugin Registration tool below
7. There you go, you can open the Plugin Registration Application under tools folder. You can undo the changes for the Assembly it is linked to Source control.
That’s it, how easy it was? Hope this would help someone.
This post is for all who are working on D365 Model Driven Apps and mainly Plugins.
Yes, you saw it right, in this blog post, we will see how can debug plugin without using our favorite plugin profiler which is very widely used from quite some time by everyone working on Plugins for Dynamics 365. All this is done by a tool called Dataverse Browser, which is not yet on XrmToolBox. Please note that there were some limitations as detailed in limitation section below.
Here are 3 simple steps to follow..
Install Dataverse Browser
Attach the Debugger
Run your actual operation.
Step into your code and debug it.
The tool embeds a web browser based on Chromium. It works by translating the Web API requests to SDK requests. Then it analyzes if plugin steps are registered on the message and it loads them, make them run locally. All other requests are sent to the Dataverse, so that the plugins are interacting with the real database.
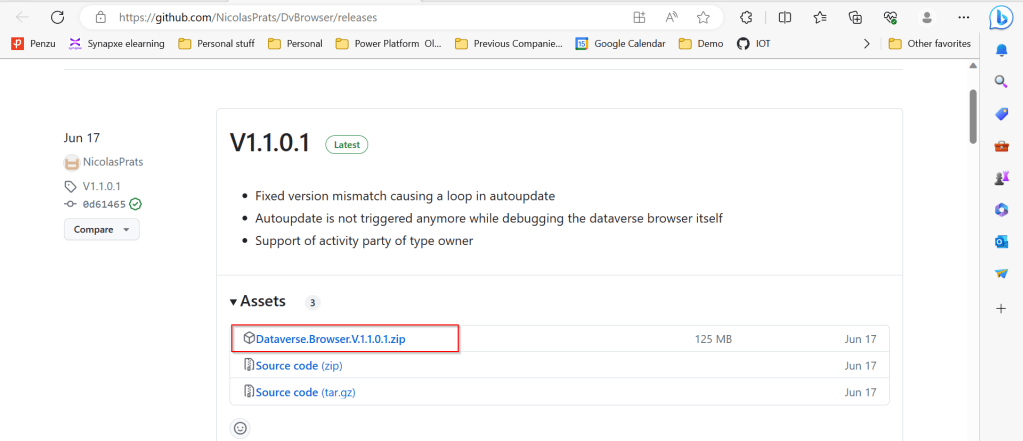
Download the latest source code of Dataverse browser here.
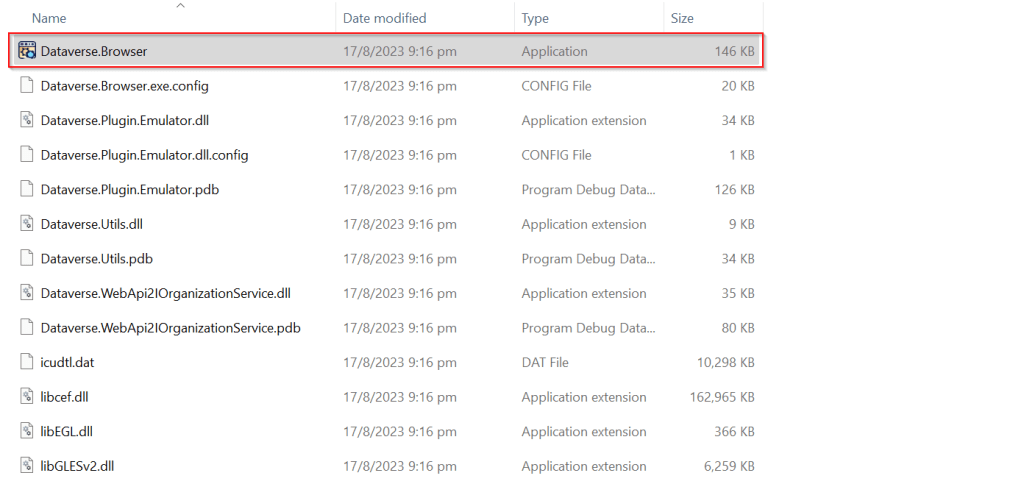
Next extract the zip file downloaded as highlighted below
Extract the zip file downloaded, open Dataverse.Browser Application as highlighted below.
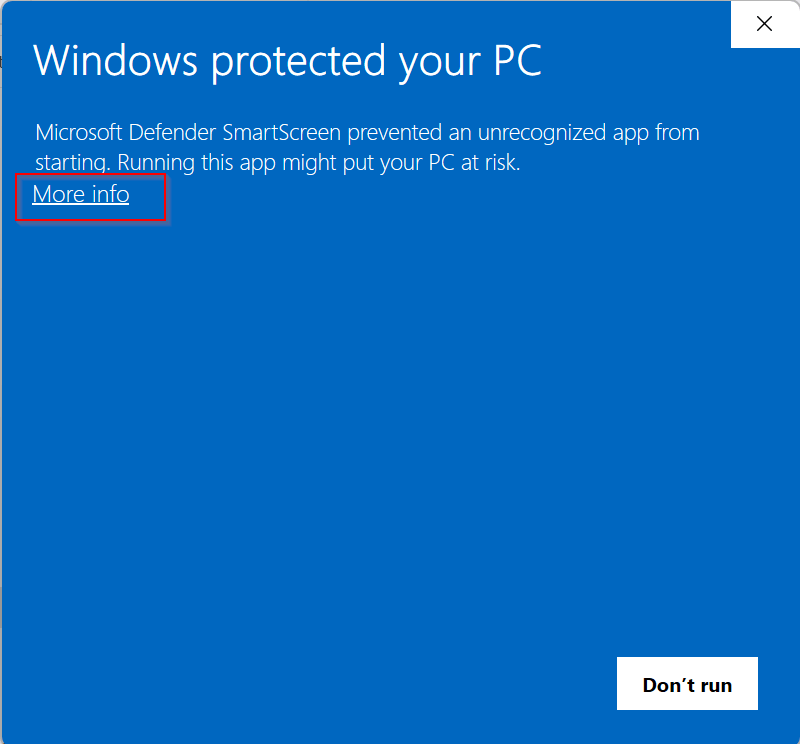
In the popup window, click on More info as highlighted below…
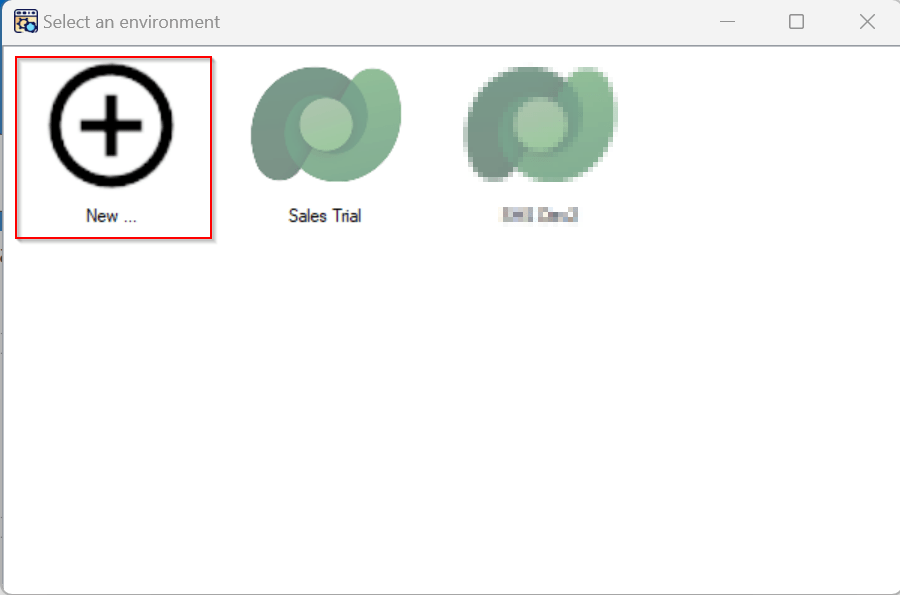
Then run the application anyway…you will be presented with a window where you can select the environment. Going forward, any time you want to open Dataverse browser, just open the Dataverse.Browser.exe and choose the environment as below.
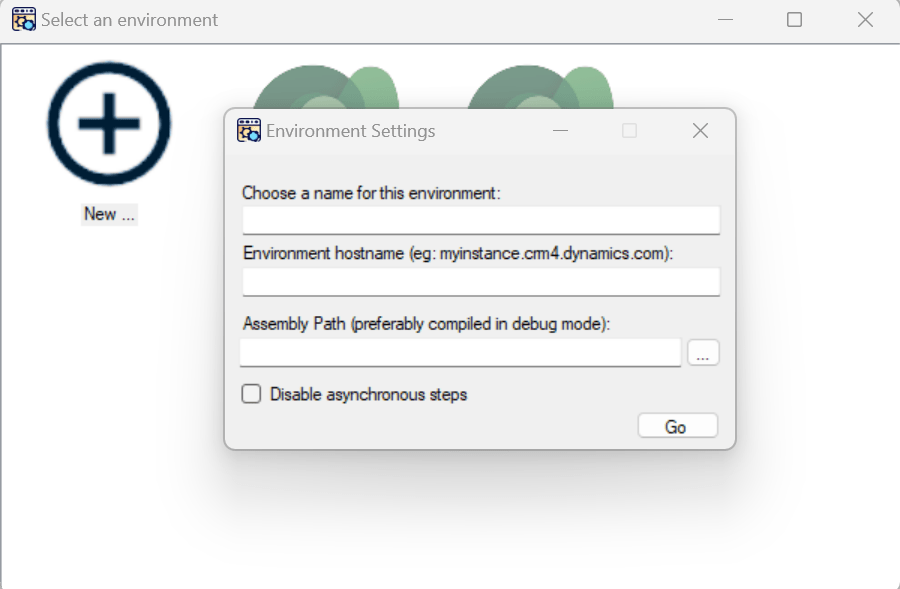
Click on New, enter the details as above and key in the details.
Enter the settings of your environment:
A name meaningful for you
The host name of your instance (without the https://)
The path to the plugins assembly file (the dll). For a better experience, it should be compiled in debug mode with the pdb file generated.
Then click Go.
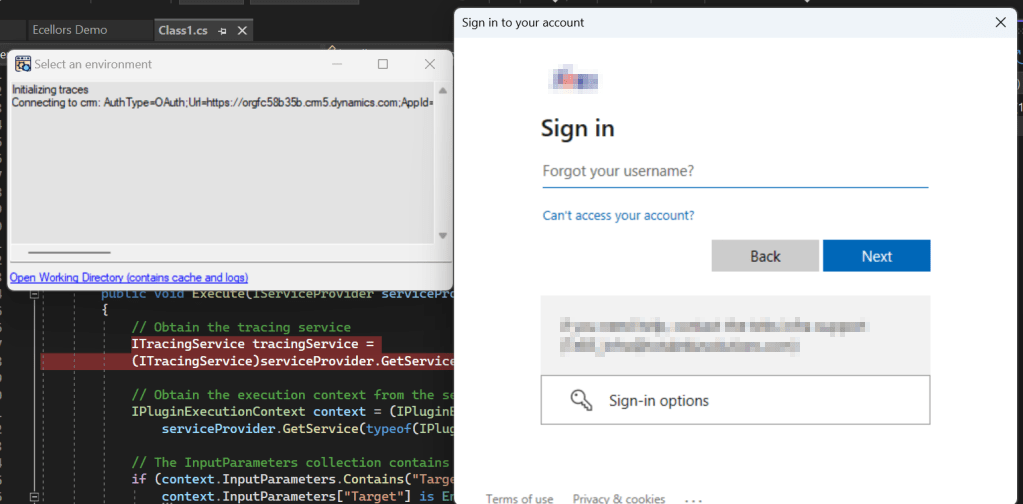
You just need to Authenticate to your instance.
Once Authenticated to the respective model driven apps, all the Web API requests sent to Dataverse will be shown as below.
I have following Plugin Libraries registered.
Next step is to choose the instance and perform the respective operation which triggers the Plugin. So, in here, I will perform an update to the Account entity from the Dataverse Browser which triggers the Plugin.
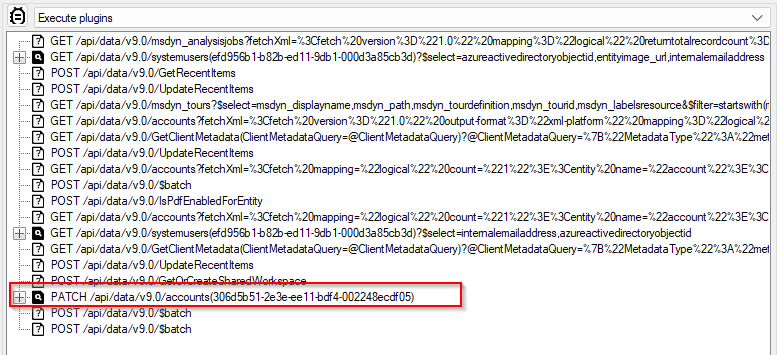
Once an update is performed, a Web API request gets recorded in the Dataverse browser as highlighted below.
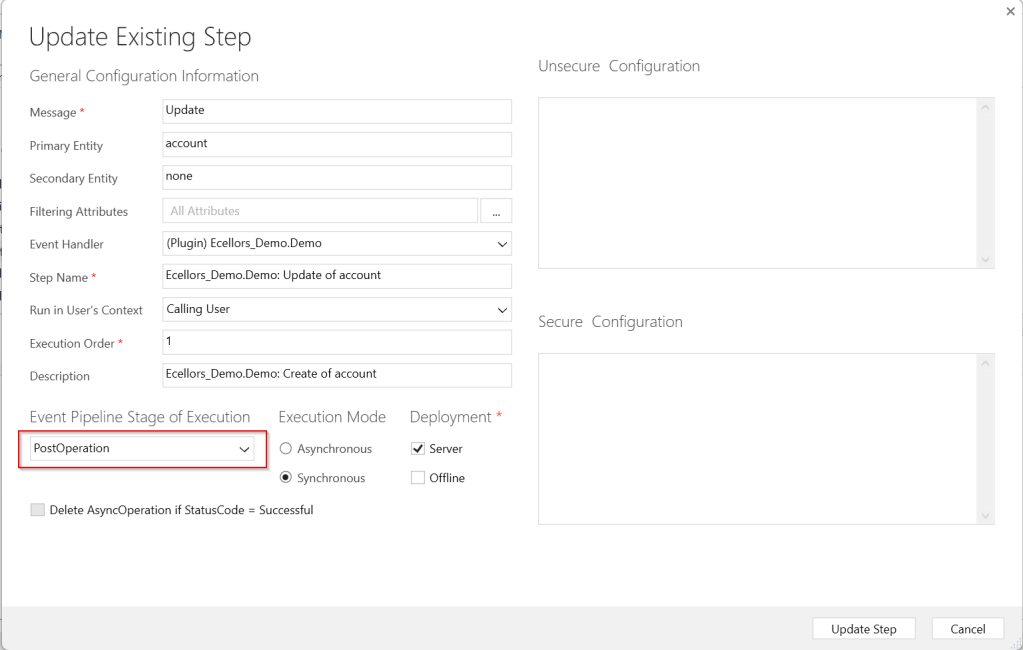
Since the Plugin is in Post Operation, i.e. Stage number is 40
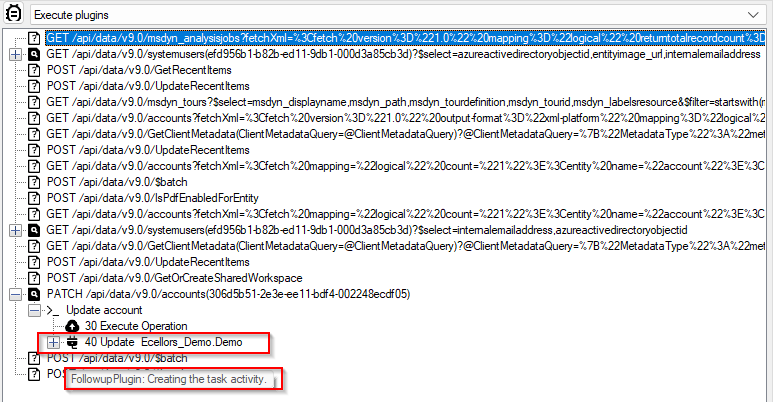
Just expand the Patch Request, you should see two operations on 30, 40, but area of interest here is for the Plugin which was registered on stage 40.
Make sure you open the Visual Studio and perform the below steps from Dataverse Browser.
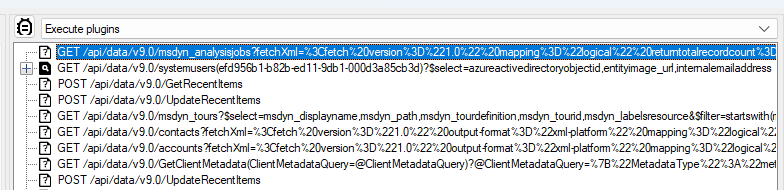
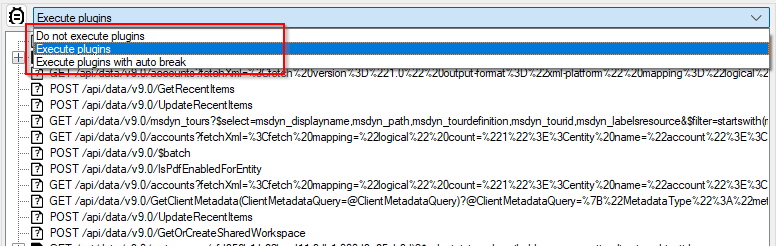
Attach the debugger from Dataverse Browser by clicking on the Plug Symbol as below which will show the list of debugger options available for you to select from. Here I have selected Execute Plugins, plugin will be invoked. You can either select any of the three options as presented below.
1.Do not execute plugins – recommended when you want to debug without actually triggering your plugin logic. i.e. With this approach even you can check the code in Production environment.
2. Execute plugins/Execute plugins with auto break – recommended when you want to debug by triggering your actual plugin, this is recommended in case your plugin code had changed recently and in Development environments.
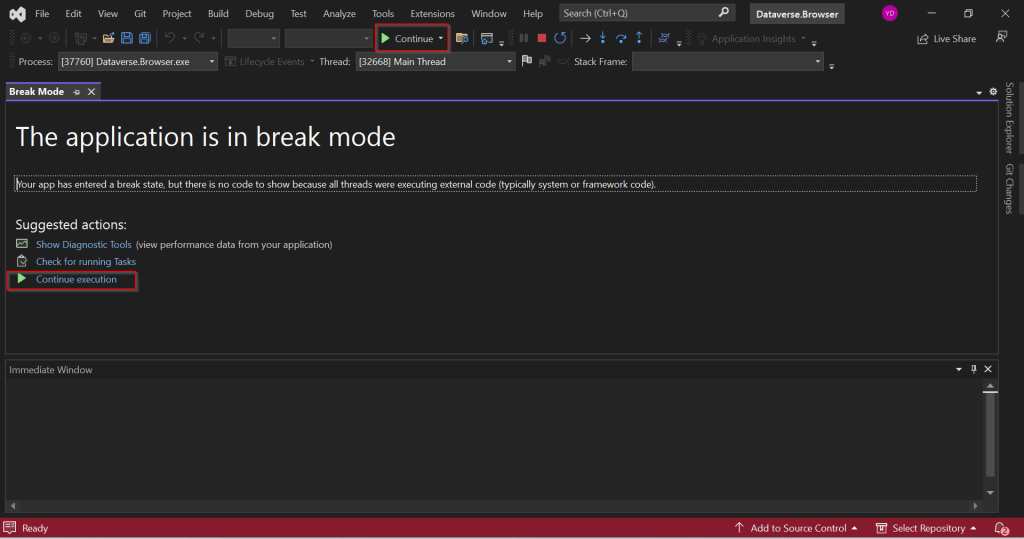
Just select Ecellors Demo – Microsoft Visual Studio: Visual Studio Professional 2022 version which will launch an existing Visual studio 2022 as below in break mode. Next click on Continue as highlighted below or press Click F5 on your keyboard.
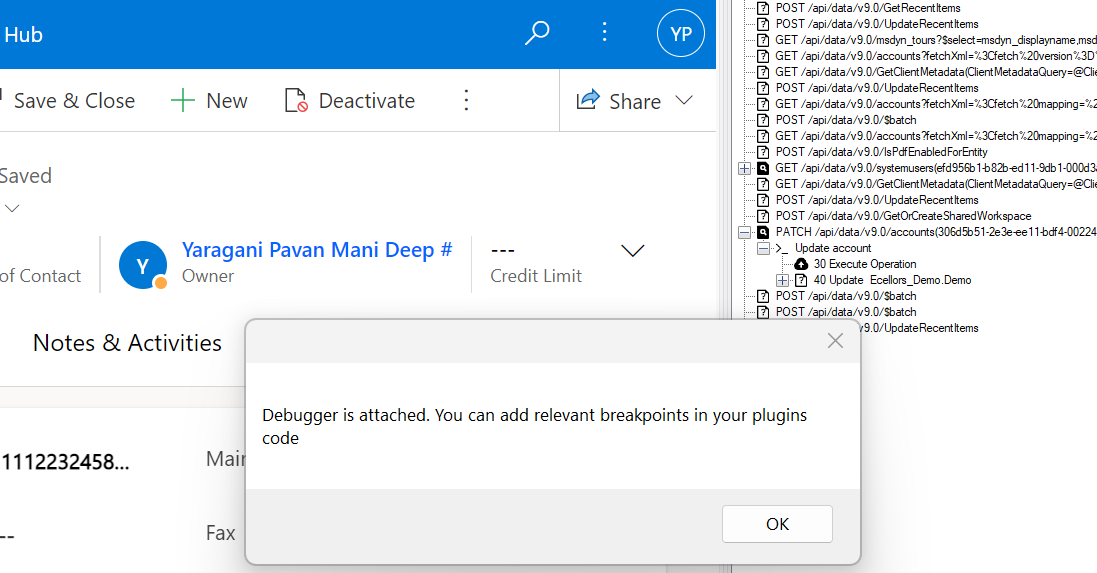
This shows you that the debugger has been attached when you navigate to Dataverse Browser asking you to place your breakpoints.
Now just place breakpoints in your code in Visual Studio. Just go back to Dataverse Browser and click on Ok on the Diaglog box.
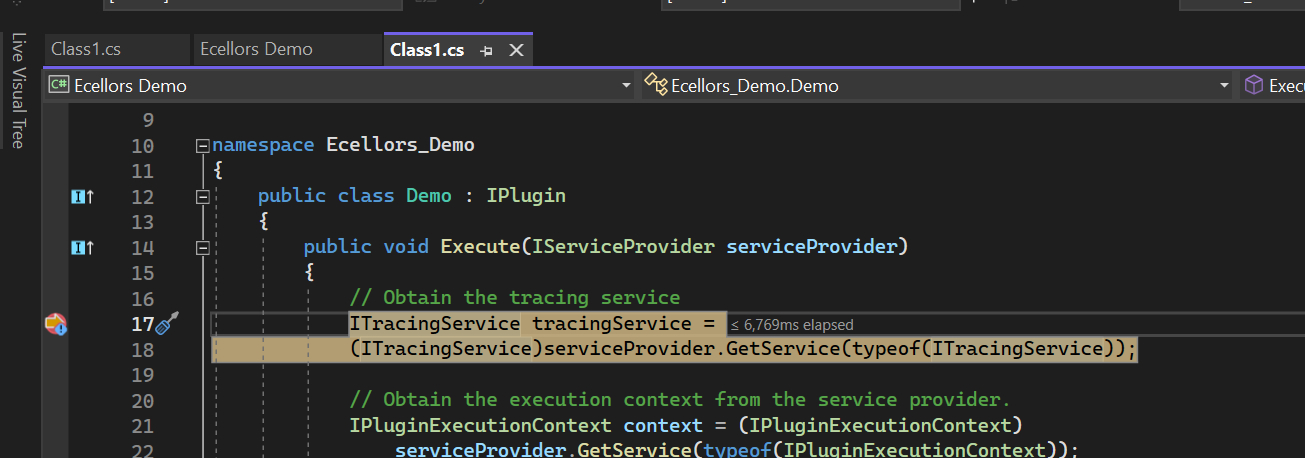
Perform the operation which triggers the Plugin from Dataverse Browser itself, this will hit the break point in Visual Studio from where you can debug your plugin.
As you might have observed, your code need not throw exception in order to debug, you could do similarly to the way you would debug using Profiler. But here just that you don’t need to deploy the latest code to the Dataverse just for debugging purpose.
This gives a lot more flexibility eases the way you debug plugins.
Limitions:
There is no support for transactions.
When plugins are triggered because of a server-side operation, they will not be run locally.
For many reasons, behavior will never be perfectly similar to the one when plugins are executed on server side.
Happy debugging, I hope you found this post useful…
Do you know that you can connect to your Dataverse DB right from your old toolbox SSMS, an express version would be more than enough to try out. Possibly we didn’t think of, but yes, we can…so let’s see that in this blog post.
Open SSMS..
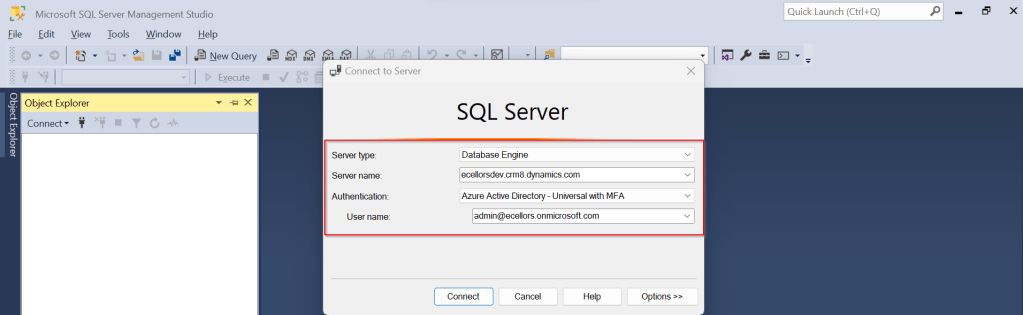
1.Select Server type as Database Engine
2. Server name as the environment URL from your Power Platform Admin Center as below.
3. So key in those details as below, make sure to Select Authentication method as Azure Active Directory – Universal with MFA option.
Once you click on Connect, you will be prompted for authentication via browser.
Once your Sign-In is successful, you will be able to see.
That’s it, how simple it was connecting to your Dataverse instances…
Having said that it’s easy to connect to Dataverse, not all operations performed using normal transact SQL are supported here using Dataverse SQL. You could see it says Read-Only besides the instance name, that means that you don’t have any capabilities to modify from SQL.
Because Dataverse SQL is a subset of Transact-SQL. If you want to see what statements are supported and what not, just go ahead to this link to find out.
This opens a whole lot of opportunities to explore, so don’t forget to check this out.
By this time, almost every Dynamics 365 Developer had some day or the other used Level up in their Custom Engagement consultant career.
While every one out in the Dynamics CRM Space know about the widely popular God mode available in Level Up which helps in the day to day administration and maintenance activity of CE applications.
Today in this blog post, lets see how we can achieve impersonation using Level up. We all know about impersonation in Dynamics CRM possibly using Plugins via Plugin Registration tool or directly through code.
But do you know, using Level Up, do you know that you even don’t need to write any piece of code but can impersonate to any user in the system with thin a few clicks right from your browser. If this interests you, just follow along…
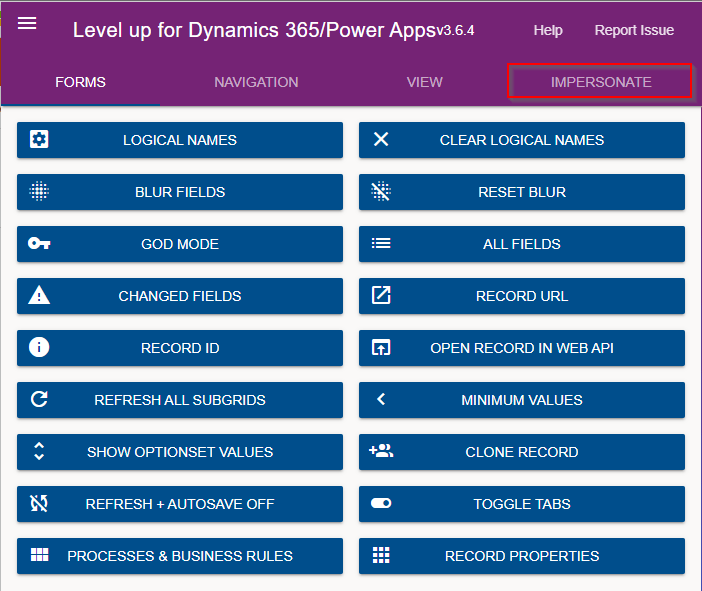
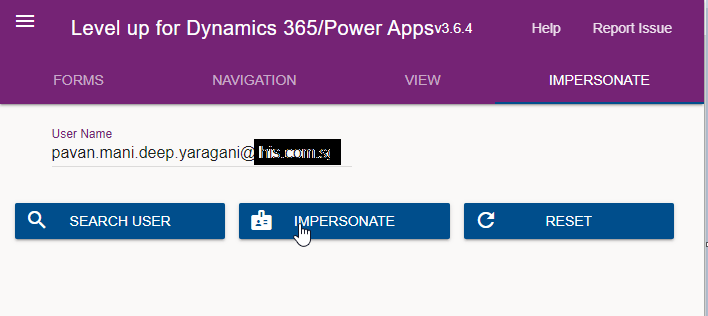
Just open the level up chrome extension. This is how your home screen look like once opened..to use this feature, just click on Impersonate as highlighted in the below image. For all this activity, I am logged in as Admin user to the system.
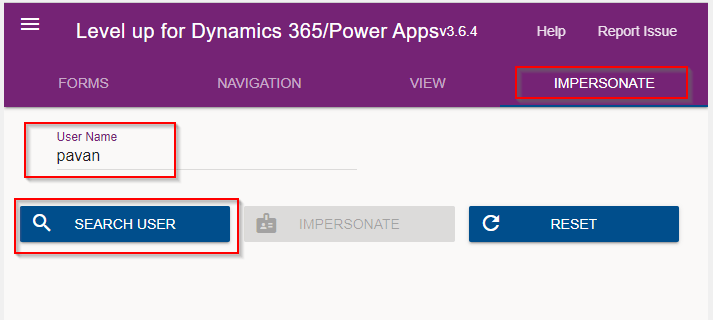
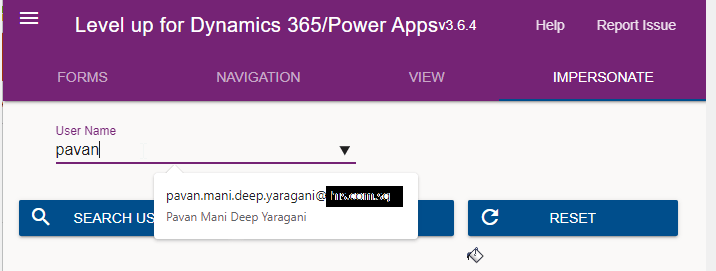
Next you can search with the username with whom you want to impersonate with i.e. here I would like to impersonate with my user account. You can search and impersonate with any user in the system.
Once you click on SEARCH USER
Upnext, click on impersonate button available as below
It opens a new window impersonated with the user account as the user choosen for the impersonation.
The screen shows as the user pavan is the logged in user…
Now you can perform all the operations same as what user pavan has…how cool is it…this feature perfects suits when you want to test out the application security roles where you would like to make a change to a user role and assign to other team member, test it without needing his/her presence. Cool to know, isn’t it….
References:
You can install the extension on Edge, Firefox and Chrome.
Every now and then when we were struck up with the issues with our code or with any power platform components like Power Automate, we had to definitely understand whether it is working from normal C# console application.
There were tons of articles over the internet and just it’s ophhhh…
So this post is just for a quick reference to connect to Dynamics 365 CE Instance to check if your actual function is returning valid data or not. I have just removed my functions for brevity.
You can just specify your Client Id, Client Secret, Instance URL below.
using System;
using System.Collections.Generic;
using System.Linq;
using System.Text;
using System.Threading.Tasks;
using Microsoft.Crm.Sdk;
using Microsoft.Crm.Sdk.Messages;
using Microsoft.Xrm.Sdk;
using Microsoft.Xrm.Tooling.Connector;
using System.ServiceModel;

namespace TestConsole
{
internal class Program
{
static void Main(string[] args)
{

        IOrganizationService orgService = GetOrganizationServiceClientSecret(your client id, your client secret, instance url);
        var response = orgService.Execute(new WhoAmIRequest());//To validate the request

        if(response != null)
        {
            Console.WriteLine("Connected to CRM");

            //Your function here
        }
    }

    public static IOrganizationService GetOrganizationServiceClientSecret(string clientId, string clientSecret, string organizationUri)
    {
        try
        {
            var conn = new CrmServiceClient($@"AuthType=ClientSecret;url={organizationUri};ClientId={clientId};ClientSecret={clientSecret}");
            return conn.OrganizationWebProxyClient != null ? conn.OrganizationWebProxyClient : (IOrganizationService)conn.OrganizationServiceProxy;
        }
        catch (Exception ex)
        {
            Console.WriteLine("Error while connecting to CRM " + ex.Message);
            Console.ReadKey();
            return null;
        }
    }
}

}
Whenever you want to check any thing from C# Console, I hope this piece code works for connecting to your Dynamics.
In today’s world, all the modern software applications use API for the front end to communicate with the backend systems, so lets see as it is very important for every developer working on Azure and API’s. Basically this is a PAAS Service from Azure. Follow along if you would like to know more details on this.
In short APIIM is a hybrid and multi cloud platform used to manage complete API life cycle. Azure API Management is made up of an API gateway, a management plane, and a developer portal.
Caching response to improve performance
Limit the number of API Calls
Security API and providing access
Interface to test API calls
API Analytics
Package related API Services
Transforms your API’s without
API Gateway is the first point of contact for any requests for your API which will route your requests to the appropriate backends. Imposes additional security restrictions with the help of JWT tokens and other certificates. Responses can be cached so that the API response could be faster.
Emits logs, metrics, and traces for monitoring, reporting, and troubleshooting
API Management are highly configurable, with control over URL mapping, query and path parameters, request and response content, and operation response caching.
Groups helps to provide conditional viewing capabilities.
Policy can help to change the behavior of an API without any code changes, this is well suited for your production API’s.
Also its easy to integrate API Management with all the other Azure Service available in the market.
Now lets go into the hands on by creating an APIIM simply from Azure.
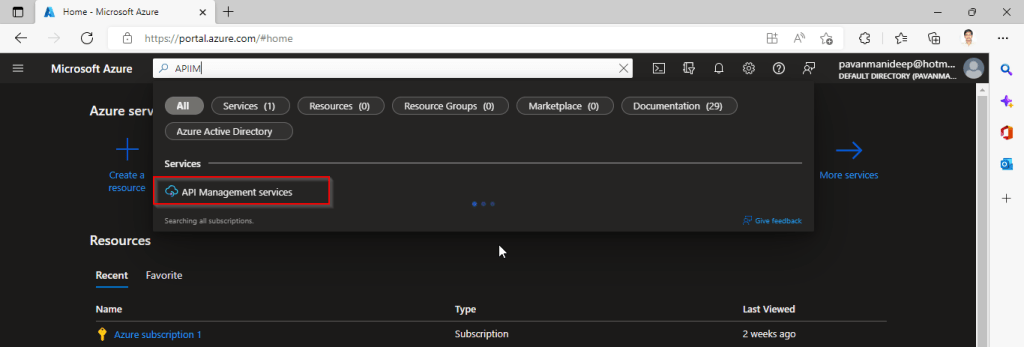
Go to Home – Microsoft Azure and search for APIIM and select API Management services and click on Create.
Input all the details, it was pretty self explanatory, coming to the pricing tier you could select based on your project needs and use case. Click on Review and Create and then Create.
It will take few minutes for the deployment to complete and you can use it.
The below Power point slide presentation is complete resource which can help you with all your queries related to Azure API Management.
I hope this gives you a bit of introduction to Azure API Management, now lets see how you can use this in your Power Platform Solutions.
For this, once your API ready, all you have do is to export your API’s from Azure API Management to your Power Platform Environment. With this the citizen developers can unleash the capabilities of Azure where the API’s are developed by professional developers. With this capability, citizen developers can use the Power Platform to create and distribute apps that are based on internal and external APIs managed by API Management.
Steps to follow would be as below:
All you need to do is to create a custom connector for your API which can be used in Power Platform like Power Apps, Power Automate etc.
Navigate to your API Management service in the Azure portal.
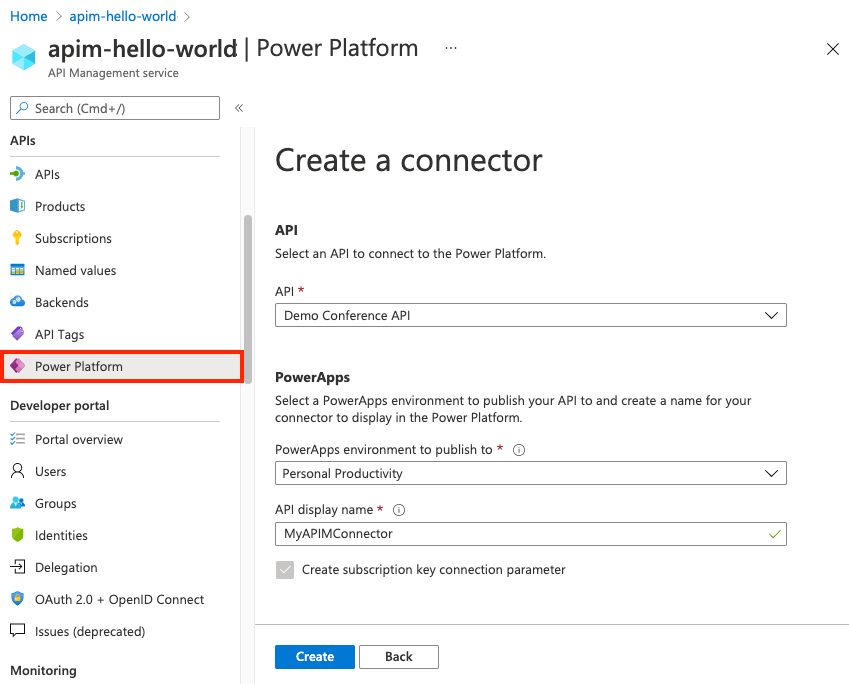
In the menu, under APIs, select Power Platform.
Select Create a connector.
In the Create a connector window, do the following:
Select an API to publish to the Power Platform.
Select a Power Platform environment to publish the API to.
Enter a display name, which will be used as the name of the custom connector.
Optionally, if the API doesn’t already require a subscription, select Create subscription key connection parameter.
Optionally, if the API is protected by an OAuth 2.0 server, provide details including Client ID, Client secret, Authorization URL, Token URL, and Refresh URL.
Select Create.
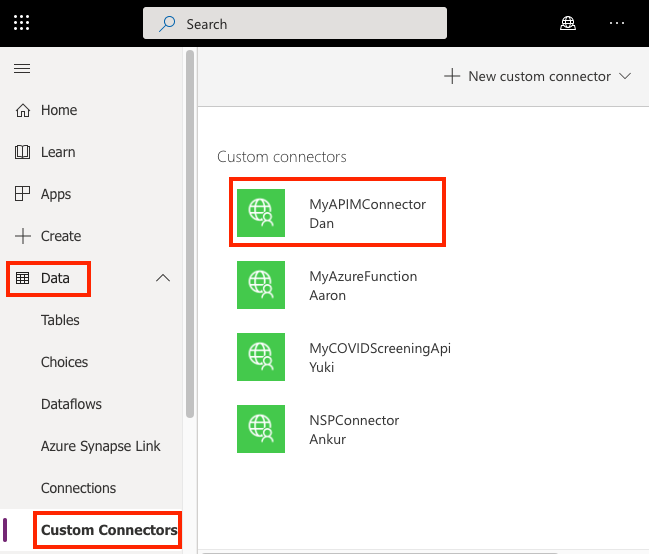
Once the connector is created, navigate to your Power Apps or Power Automate environment. You will see the API listed under Data > Custom Connectors.
I hope this will give you a complete picture about API Management in Azure…if you have any further queries, don’t hesitate to comment here…
Power Platform Tools for Visual Studio supports the rapid creation, debugging, and deployment of plug-ins.
You may note that Power Platform Tools for Visual Studio is similar in appearance and function to the Developer Toolkit for Microsoft Dynamics CRM 2013.
While Power Platform Tools for Visual Studio is similar in appearance and function to the Developer Toolkit for Microsoft Dynamics CRM 2013, Power Platform Tools is a new product and completely independent of the Developer Toolkit.
Power Platform Tools is not directly compatible with any templates or projects from the Developer Toolkit and vice versa.
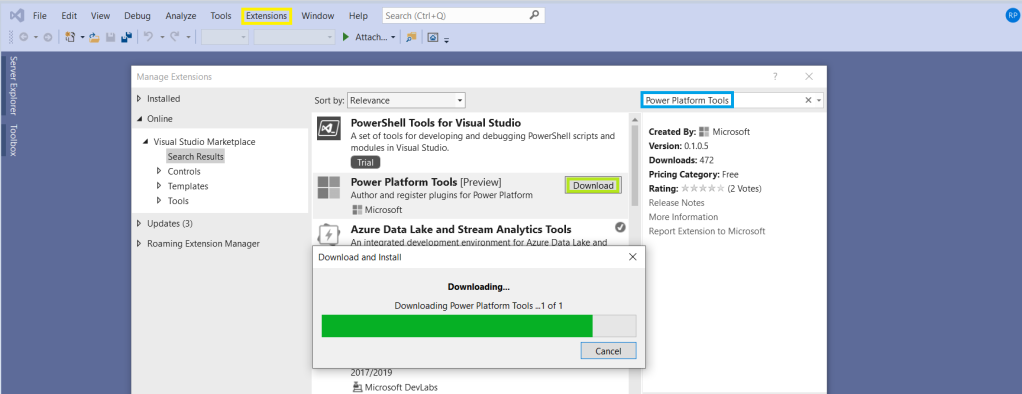
Steps to enable ‘Power Platform Tools’ extension in VS 2019:
From the Visual Studio 2019, click on ‘Extensions -> Manage Extensions’.
Expand the left navigation panel node Online > Visual Studio Marketplace. Search for “Power Platform Tools”, then click on ‘Download’.
Post Download, close all the Visual Studio instances and wait for few seconds…
Have you ever had an issue where you need logging mechanism to troubleshoot…
Out there we have some 3rd party software which can help with this…but we can use Notes entity in CE so that we can enable logging to our .Net Assembly code with out any other 3rd party additions.
So today, I would like to give you a list of most useful tools available till now for Dynamics CRM which increases the developer productivity and helps Admins.
Some great tools you should check out to see if they could work in your organization.
CRM DevTools – Chrome extension visible in the F12 developer area with lots of helpful functions for admins. It is worth it just to remember the debug and diagnostic links
Link Buddy – It’s useful for converting logging/tracing details from CRM plug-ins, custom apps, etc. into click-able links that open the CRM record for which the GUID represents.
Convert FetchXML to SQL query – people find difficulties in converting the fetch xml query created from advanced find to a SQL query to retrieve records from Backend, use this tool to help the same
Convert SQL query to Fetch XML – Two way round, use this to convert your backend queries to fetch XML to use them in your Code to retrieve data and metadata.
Diagnostics Tool for On premise – Helps CRM developers and administrators to enable trace and devErrors on CRM server. Whereas its name only mentions CRM 2011, it is compatible with CRM 2013 and 2015 too (OnPremise only)
Fetch XML Formatter 1, Fetch XML Formatter 2– Two similar tools for the same functionality, use according to your convenience. These were lightweight windows application that tool will be help you when you are extensively working with FetchXML in Javascript / C# code to get desired result. Takes fetchXML from Advance Find as an input and convert that into desired format, which can be used into Javascript / C# for further coding.
Local option set to Global optionset converter – It’s purpose is to automate the task of converting a Local Option Set (an option set that is defined by and specific to a single entity. e.g. a CRM 4.0 Picklist), into a Global Option Set.
Win Merge – A great tool to compare customizations.xml files taken from solutions
CRM Rest Builder – A tool for CRM 2011/2013/2015/2016 Online & On Premise to generate JavaScript code using the 2011 & Web API REST endpoints.
TableTools2 – Add on for only Mozilla firefox to improve the CRM Grids. You can use the addon in grids that don’t display a filter or just in general with any page that displays a table like structure.
CRM Theme Generator – Use this tool to generate the feature and create themes in CRM, supporting latest versions
Advanced Query outer Join – Plugin to enable outer join queries from Advanced Find. This plugin enabled you to do that. The plugin runs on pre-RetrieveMultiple and alter the query that gets sent to the pipeline, with the correct outer join conditions
Easy VS Code in Action – Use this to work with JavaScript file types from your desktop itself and without opening visual studio
Custom code validation tool – Between CRM 2015 and CRM 2016 there are no differences for the checking of unsupported customizations of Js code, so if you get results to fix with the 2015 custom code validation tool means that you need to fix as well for 2016
CRM DevTools – from Sonoma Partners is a Chrome extension which quickly provides CRM record and environment information and makes troubleshooting and testing so much easier. Once it’s installed, you can access the features by going to the Chrome DevTools (F12 key) and clicking the CRM DevTools tab.
Dynamics 365 developer extensions(tool kit) – Tool to search for CRM related MSDN content, and tooling to assist with managing and deploying web resources, plug-ins, and reports
Network Visualisation tool – Visualize the relationships between accounts, contacts and activities in a network graph, refer to this video to get insights
Level up for dynamics CRM – Works with Edge and Chrome only. Gives form helpers and Navigation helpers, an amazing tool
Ribbon workbench 2016 – Most user friendly and universally accepted tool to customize ribbon, note that this version don’t need Silverlight within your browser
ilspy – Used to decompile your source code from your .NET DLL, helpful to find your source code from plugin DLL’s
Autonumbering solution – free autonumbering solution used to generate a Unique Reference Number for new records so they can easily be tracked, and is also useful for integrations.
ReSharper – on the fly code analysis, identifies problems and provides quick fixes, best addin to visual studio
Scribe Insights – Good data migration platform to move data between two systems and create new records in MS CRM. Reasonably the best in terms of performance with such a kind of UI and easy to learn. Comes with one month free trial.
CRM Maintenance Job Editor – Used to reschedule jobs that have caused performance issues in the CRM, it would also allow you to schedule the recurrence pattern of the Jobs to be executed during the day
SOAP UI – Most widely used tool for testing web services and other API’s without much hassles.
DLL Extractor – Extract your plugin DLL’s located on your CRM Database, this applies only for On premise applications. Login to your Client network and specify the server and database name with Integrated security or SQL Authentication. Click on List Plugins which shows the assemblies registered and download the required ones.