By this time, almost every Dynamics 365 Developer had some day or the other used Level up in their Custom Engagement consultant career.
While every one out in the Dynamics CRM Space know about the widely popular God mode available in Level Up which helps in the day to day administration and maintenance activity of CE applications.
Today in this blog post, lets see how we can achieve impersonation using Level up. We all know about impersonation in Dynamics CRM possibly using Plugins via Plugin Registration tool or directly through code.
But do you know, using Level Up, do you know that you even don’t need to write any piece of code but can impersonate to any user in the system with thin a few clicks right from your browser. If this interests you, just follow along…
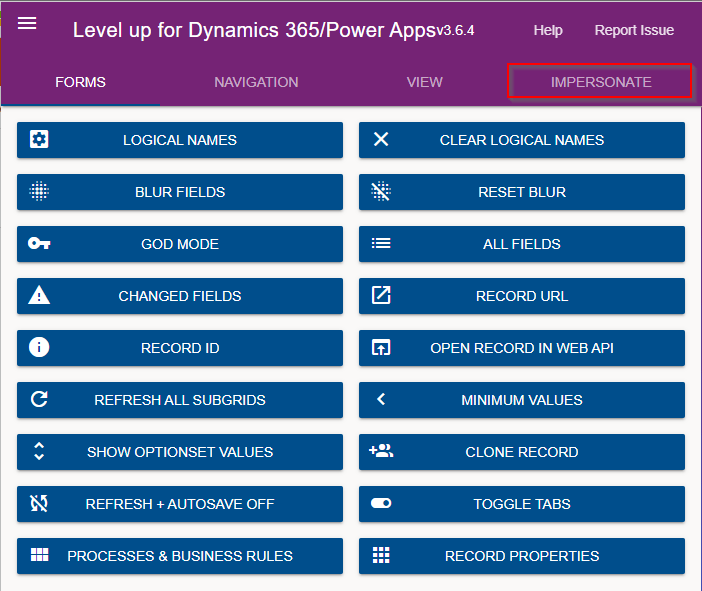
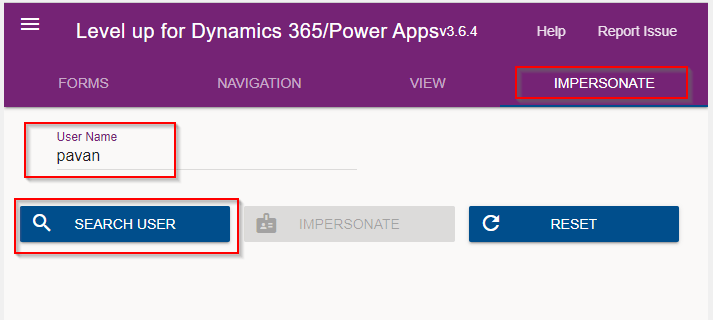
Just open the level up chrome extension. This is how your home screen look like once opened..to use this feature, just click on Impersonate as highlighted in the below image. For all this activity, I am logged in as Admin user to the system.
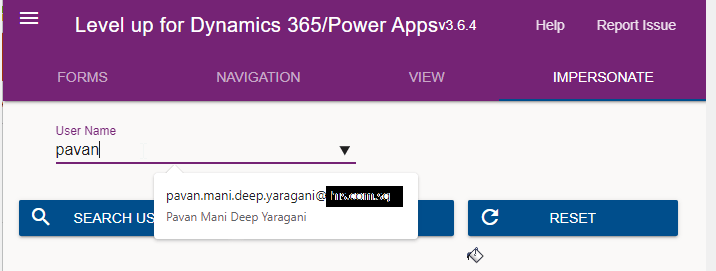
Next you can search with the username with whom you want to impersonate with i.e. here I would like to impersonate with my user account. You can search and impersonate with any user in the system.
Once you click on SEARCH USER
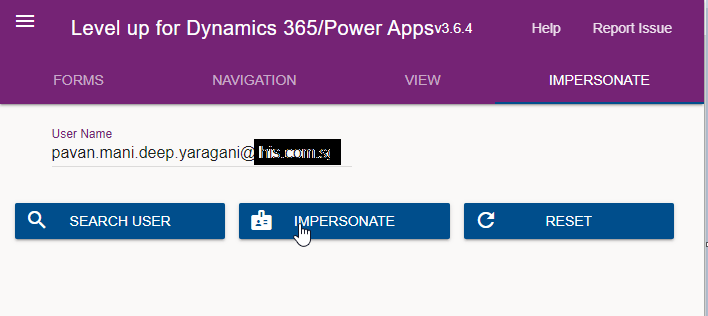
Upnext, click on impersonate button available as below
It opens a new window impersonated with the user account as the user choosen for the impersonation.
The screen shows as the user pavan is the logged in user…
Now you can perform all the operations same as what user pavan has…how cool is it…this feature perfects suits when you want to test out the application security roles where you would like to make a change to a user role and assign to other team member, test it without needing his/her presence. Cool to know, isn’t it….
References:
You can install the extension on Edge, Firefox and Chrome.
Have you or some one in your team accidentally deleted some your flows and want them to be back..? Then this post is for you…
There are the two ways you can restore deleted flows up to 20 days in either way…once after 20 days, even Microsoft Support couldn’t recover your flows.
In this blog post, we will see how you can recover your flows using first approach using Power Automate Management connector which is much simpler.
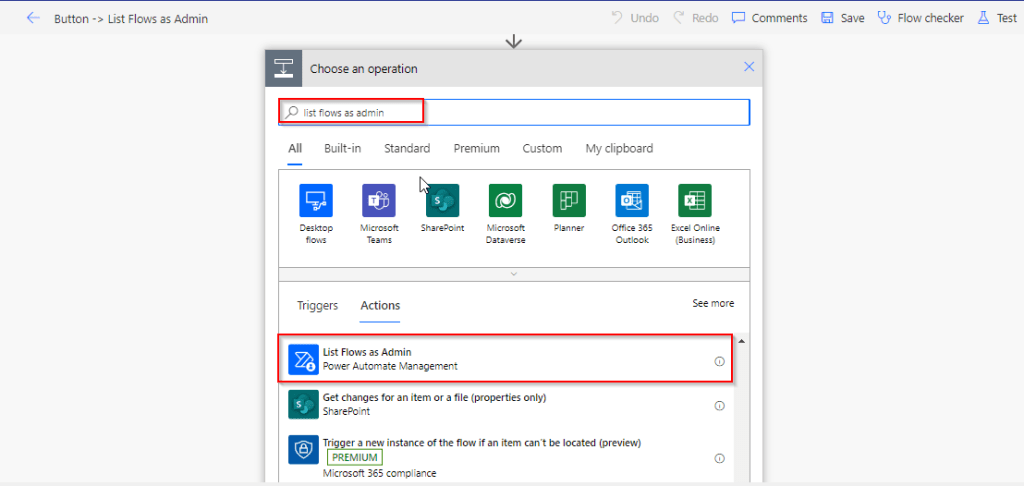
All you need is a button flow with two Power Automate management connector actions—List Flows as Admin and Restore Deleted Flows as Admin.
So let’s see…
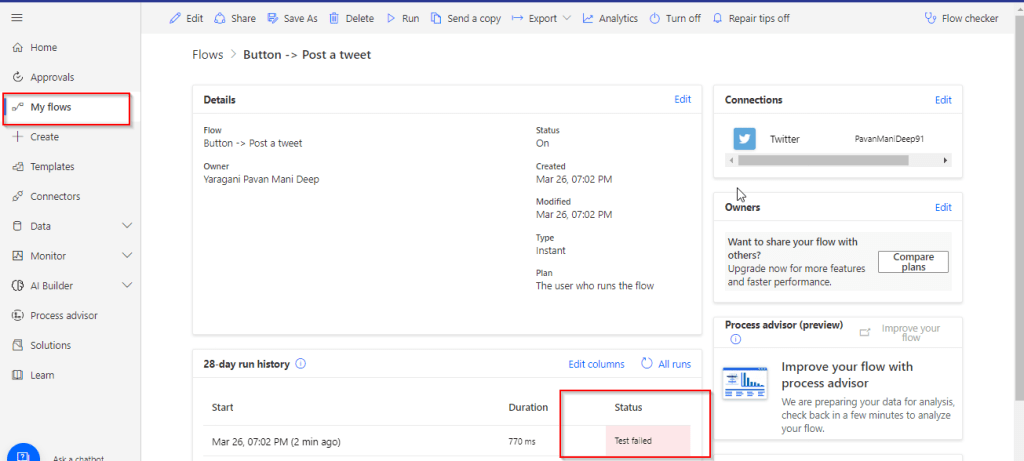
I have a very simple flow as below…
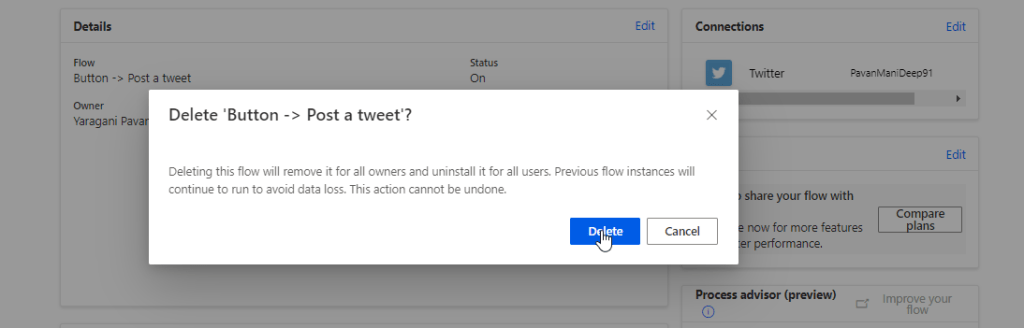
But is has been failing due to some authentication issue, so I have deleted it…
Later I understood the root cause for the authentication issue, I want the flow created to be back. But no problem, you can recover your flow as below…So follow these steps to quickly get your deleted flow back…using an another flow…
Choose a manual trigger…
Next add an action, and choose an operation by searching list flows as admin.
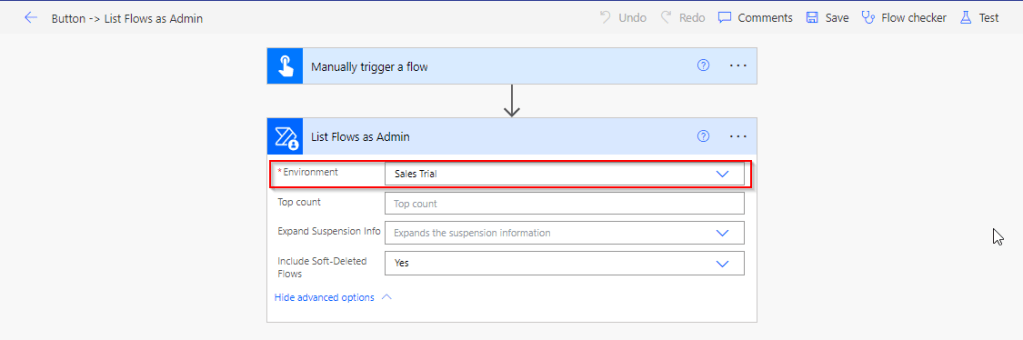
Select your environment in the connector
Save your flow and test it…
Once your flow is successful, verify the outputs..scroll to find out the flow, check for the display name and note down the name associated.
This connector will list down all the flows created in your tenant…when you expand the raw OUTPUTS/value. Note the name which is nothing but the Guid of your flow.
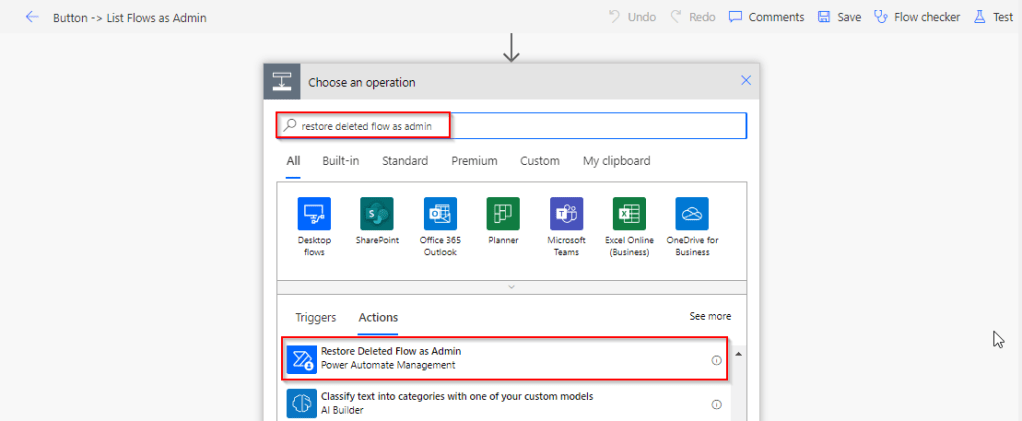
Add Restore Deleted Flows as Admin action and run the flow by searching for the same as below.
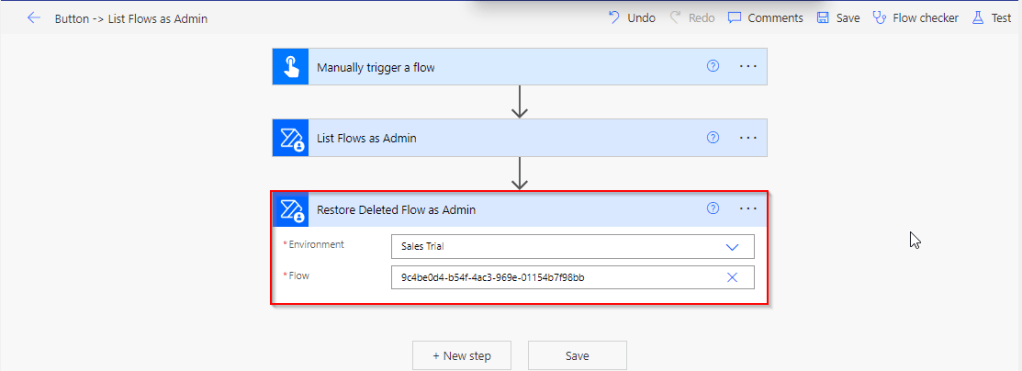
Add the Restore Deleted Flows as Admin action from the Power Automate Management Connector.
In the Flow field, enter the name value ie. Guid noted from previous step ie.
9c4be0d4-b54f-4ac3-969e-01154b7f98bb
Save the flow, and test/run it.
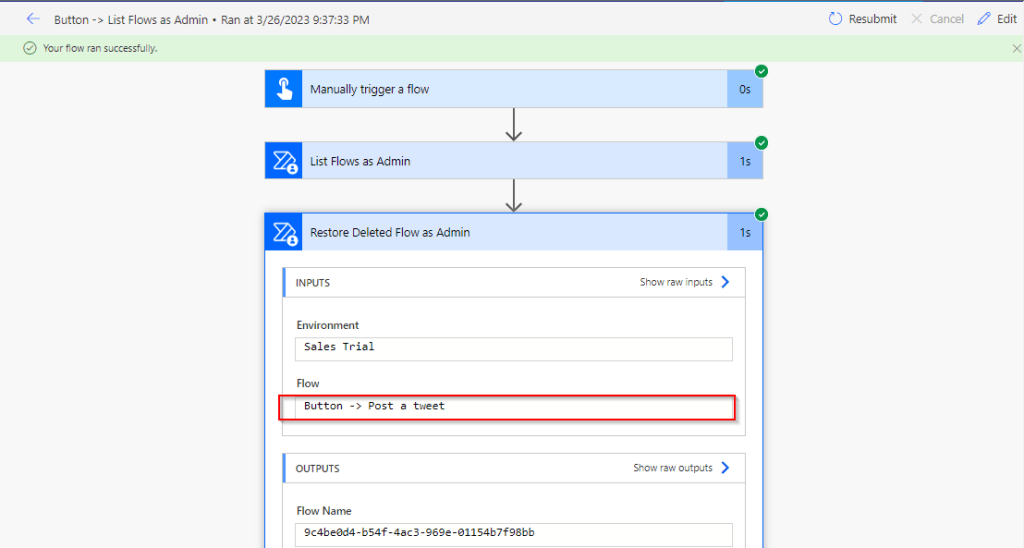
You can note your flow is back, you can find out under My Flows but it’s disabled state.
Note:
The steps in this article apply to both non-solution and solution flows.
Flows that were deleted more than 20 days ago can’t be recovered. Both restore methods (PowerShell script and Power Automate Management connector), as well as Microsoft Support can’t help to restore them.
After you restore a flow, it defaults to the disabled state. You must manually enable the flow, per your requirements.
This blog post is all about performance considerations for your Power Platform CE Projects and how you can plan to optimize application performance for your Power Apps. So I just want to take you through them…
Are you tired of creating solutions for longer durations and while at the end of the project or during UAT you end up facing performance issues for the solutions you have developed, one of the most important non-functional requirements for a project’s success is Performance. Satisfying performance requirements for your users can be a challenge. Poor performance may cause failures in user adoption of the system and lead to project failure, so you might need to be careful for every decision you take while you design your solutions in the below stages.
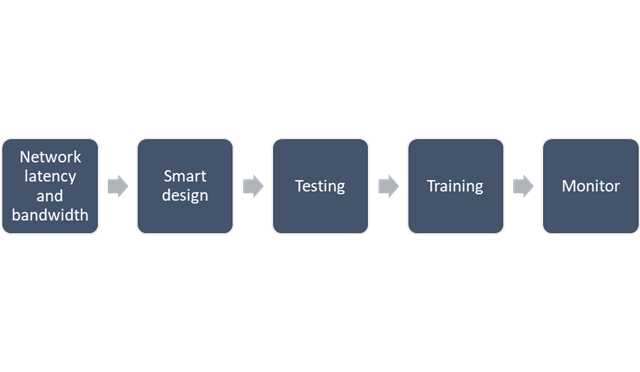
Let’s talk about them one by one..
1. Network Latency and bandwidth
A main cause of poor performance of Dynamics 365 apps is the latency of the network over which the clients connect to the organization.
Bandwidth is the width or capacity of a specific communications channel.
Latency is the time required for a signal to travel from one point on a network to another and is a fixed cost between two points. And usually many of these “signals” travel for a single request.
Lower latencies (measured in milliseconds) generally provide better levels of performance. Even if the latency of a network connection is low, bandwidth can become a performance degradation factor if there are many resources sharing the network connection, for example, to download large files or send and receive email.
Dynamics 365 apps are designed to work best over networks that have the following elements:
Bandwidth greater than 50 KBps (400 kbps)
Latency under 150 ms
These values are recommendations and don’t guarantee satisfactory performance. The recommended values are based on systems using out-of-the box forms that aren’t customized.
If you significantly customize the out-of-box forms, it is recommend that you test the form response to understand bandwidth needs.
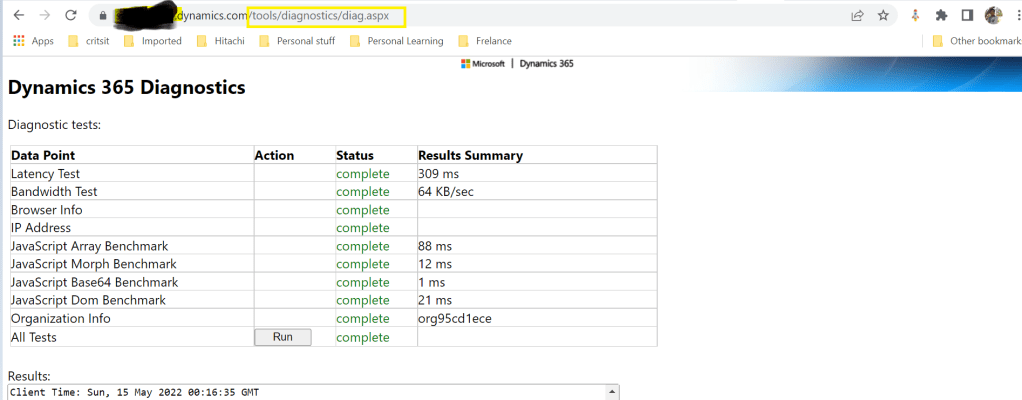
You can use the diagnostics tool to determine the latency and bandwidth:
On your computer or device, start a web browser, and sign in to an organization.
Also, to mitigate higher natural latency for global rollouts, customers should leverage Dynamics 365 Apps successfully by having smart design for their applications.
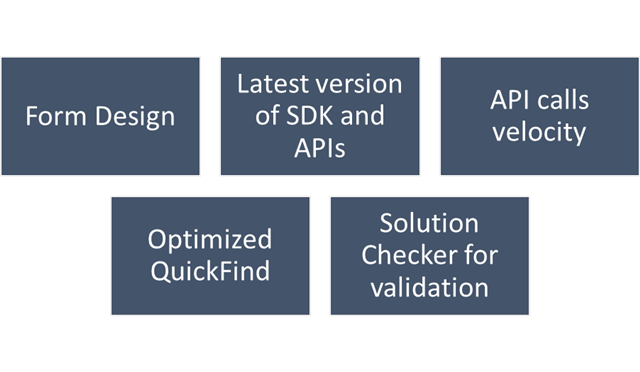
2.Smart Design for your application
Form design
Keep the number of fields to a minimum. The more fields you have in a form, the more data that needs to be transferred over the internet or intranet to view each record. Think about the interaction the user will have with the form and the amount of data that must be displayed within it.
Avoid including unnecessary JavaScript web resource libraries. The more scripts you add to the form, the more time it will take to download them. Usually, scripts are cached in your browser after they are loaded the first time, but the performance the first time a form is viewed often creates a significant impression.
Avoid loading all scripts in the Onload event. If you have code that only supports OnChange events for fields or the OnSave event, make sure to set the script library with the event handler for those events instead of the OnLoad event. This way loading those libraries can be deferred and increase performance when the form loads.
Use tab events to defer loading web resources. Any code that is required to support web resources or IFRAMEs within collapsed tabs can use event handlers for the TabStateChange event and reduce code that might otherwise have to occur in the OnLoad event.
Set default visibility options. Avoid using form scripts in the OnLoad event that hide form elements. Instead set the default visibility options for form elements that might be hidden to not be visible by default when the form loads. Then, use scripts in the OnLoad event to show those form elements you want to display. If the form elements are never made visible, they should be removed from the form rather than hidden.
Avoid opening a new tab or window and do open the window in the main form dialog.
For Command Bar, keep the number of controls to a minimum. Within the command bar or the ribbon for the form, evaluate what controls are necessary and hide any that you don’t need. Every control that is displayed increases resources that need to be downloaded to the browser. Use asynchronous network requests in Custom Rules When using custom rules that make network requests in Unified Interface, use asynchronous rule evaluation.
Only the columns required for information or action should be included in API calls:
Retrieving all columns (*) creates significant overhead on the database engine when distributed across significant user load. Optimization of call velocity is key to avoid “chatty” forms that unnecessarily make repeated calls for the same information in a single interaction.
You should avoid retrieving all columns in a query result because of the impact on a subsequent update of records. In an update, this will set all field values, even if they are unchanged, and often triggers cascaded updates to child records. Leverage the most efficient connection mechanism (WebAPI vs SDK) and reference this doc site for guidance on the appropriate approach.
You should continue to use the ITracingService.Trace to write to the Plug-in Trace Log table when needed. If your plug-in code uses the ILogger interface and the organization does not have Application Insights integration enabled, nothing will be written. So, it is important to continue to use the ITracingService Trace method in your plug-ins. Plug-in trace logs continue to be an important way to capture data while developing and debugging plug-ins, but they were never intended to provide telemetry data.
For organizations using Application Insights, you should use ILogger because it will allow for telemetry about what happens within a plug-in to be integrated with the larger scope of data captured with the Application Insights integration. The Application Insights integration will tell you when a plug-in executes, how long it takes to run and whether it makes any external http requests. Learn more about tracing in plugins Logging and tracing (Microsoft Dataverse) – Power Apps | Microsoft Learn.
Use Solution Checker to analyze solution components
Best practice is to run Solution Checker for all application code and include it as mandatory step while you design solutions or check when you complete developing your custom logic.
Quick Find
For an optimal search experience for your users consider the next:
All columns you expect to return results in a quick find search need to be included in the view or your results will not load as expected.
It is recommended to not use option sets in quick find columns. Try using the view filtering for these.
Minimize the number of fields used and avoid using composite fields as searchable columns. E.g., use first and last name as searchable vs full name.
Avoid using multiple lines of text fields as search or find columns.
Evaluate Dataverse search vs using leading wildcard search
3. Training
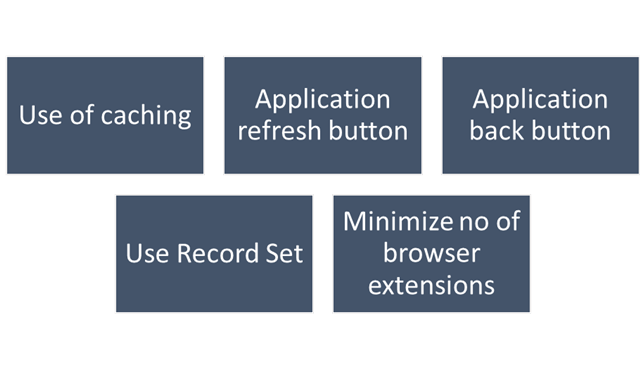
This step should be done during user training or during UAT. To ensure optimal performance of Dynamics 365, ensure that users are properly leveraging browser caching. Without caching, users can experience cold loads which have lower performance than partially (or fully) warm loads.
Train users to not clear the browser cache manually.
Check if devices have enough space allocated for browser cache.
Make sure to train users to:
Use application inline refresh over browser refresh (should not use F5)
Use application inline back button instead browser’s back button.
Avoid InPrivate/Incognito modes in browser which causes cold loads.
Make users aware that running applications which consumes lot of bandwidth (like video streaming) may affect performance.
Do not install browser extensions unless they are necessary (this might be also blocked via policy)
Do use ‘Record Set’ to navigate records quickly without switching from form back to the list.
4. Testing
For business processes where performance is critical or processes having complex customizations with very high volumes, it is strongly recommended to plan for performance testing. Consider reviewing the below technical talk series describing important performance considerations, as well as sharing practical examples of how to set up and execute performance testing, and analyze and mitigate performance issues. Reference: Performance Testing in Microsoft Dynamics 365 TechTalk Series – Microsoft Dynamics Blog
5. Monitoring
You should define a monitoring strategy and might consider using any of the below tools based on your convenience.
Monitor Dynamic 365 connectivity from remote locations continuously using network monitoring tools like Azure Network Performance Monitor or 3rd party tools. These tools help identify any network related problems proactively and drastically reduce troubleshooting time of any potential issue.
Application Insights, a feature of Azure Monitor, is widely used within the enterprise landscape formonitoring and diagnostics. Data that has already been collected from a specific tenant or environment is pushed to your own Application Insights environment. The data is stored in Azure Monitor logs by Application Insights, and visualized in Performance and Failures panels under Investigate on the left pane. The data is exported to your Application Insights environment in the standard schema defined by Application Insights. The support, developer, and admin personas can use this feature to triage and resolve Telemetry events for Microsoft Dataverse – Power Platform | Microsoft Learn
Dataverse and PowerApps analytics in the Power Platform Admin Centre. Through the Plug-in dashboard in the Power Platform Admin Center you can view metrics such as average execution time, failures, most active plug-ins, and more.
Dynamics 365 apps include a basic diagnostic tool that analyzes the client-to-organization connectivity and produces a report.
Monitor is a tool that offers makers the ability to view a stream of events from a user’s session to diagnose and troubleshoot problems. Works both for model driven apps and canvas apps.
I hope this blog post had helped you learn or know something new…thank you for reading…
Today I am writing about a simple tip about Power Automate trigger which exists from quite a while but many people might not know it…stop the suspense. Let’s get into the use case…for Power Automate flows running on a trigger..
Are you tired of making the action which triggers your flow each and every time, then you can use this tip..
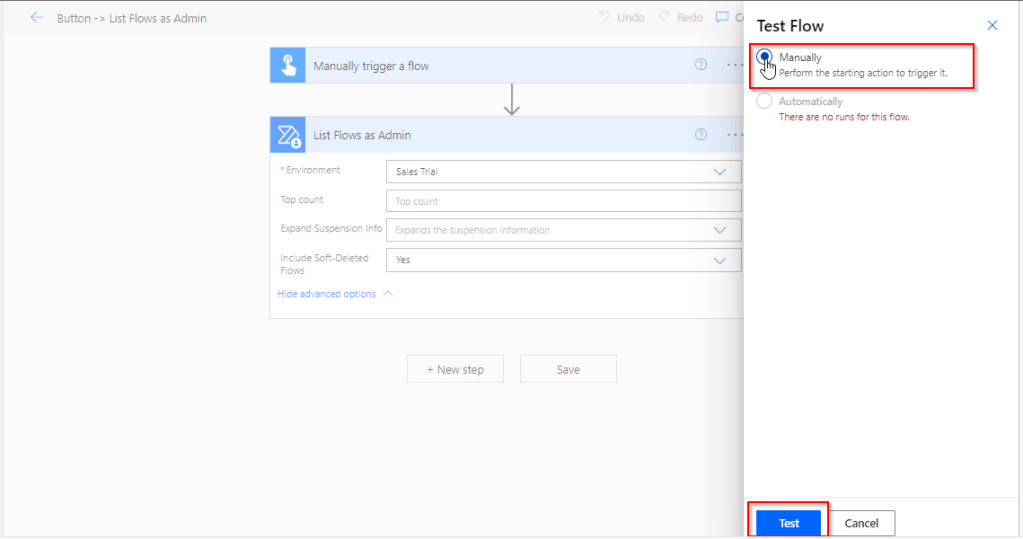
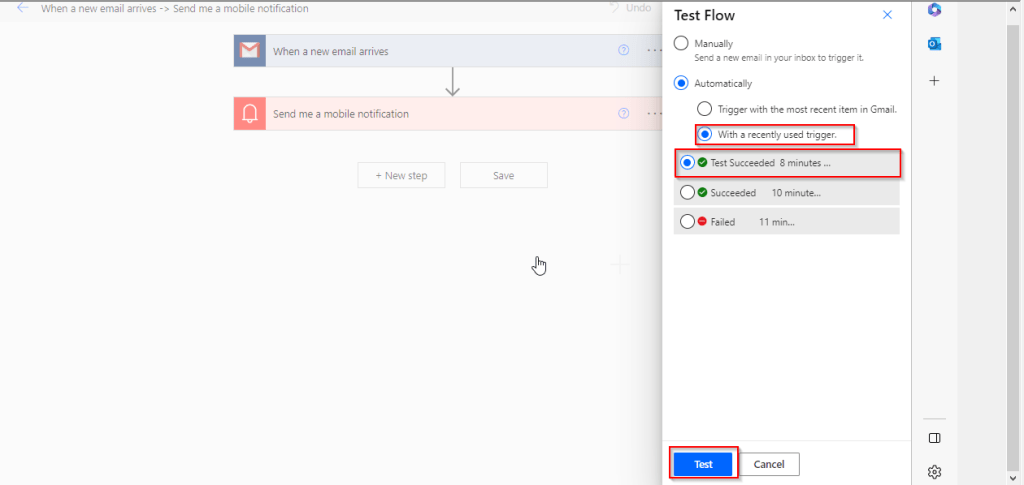
Just click on Test from top right bar as below..
Then in the pop up menu, select Automatically and check With a recently used trigger.
Later you can select any of the recently successful or failed executions to re-trigger your flow, no more hassles or manual actions to trigger your flow.
Hope this helps some one…trying to re-trigger their Automated cloud flows…without invoking their flow using an actual trigger.
I believe ever Power Platform professional working on Dataverse had one or other time got a chance to work on calculated fields. Actually it provides an easy way to perform any calculations for the supported data types since it has been introduced with CRM Version 2015 update 1.
Here is a very simple example of simple calculation to get your Fx data type up and running in few seconds….follow along….
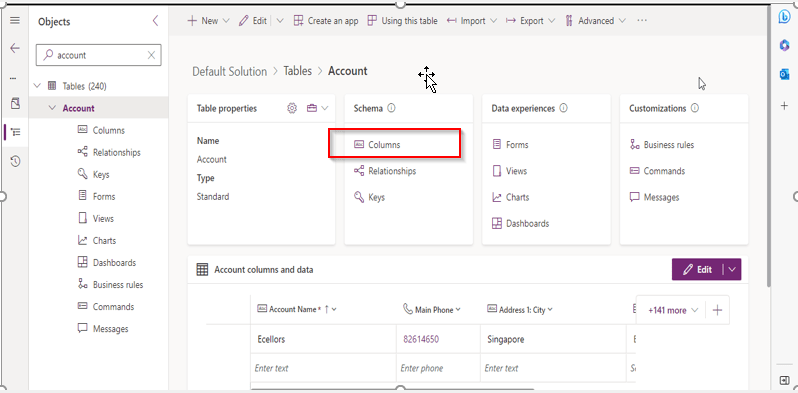
Open your solution, navigate to the columns in any table….for simplicity I am taking example of Accounts table…
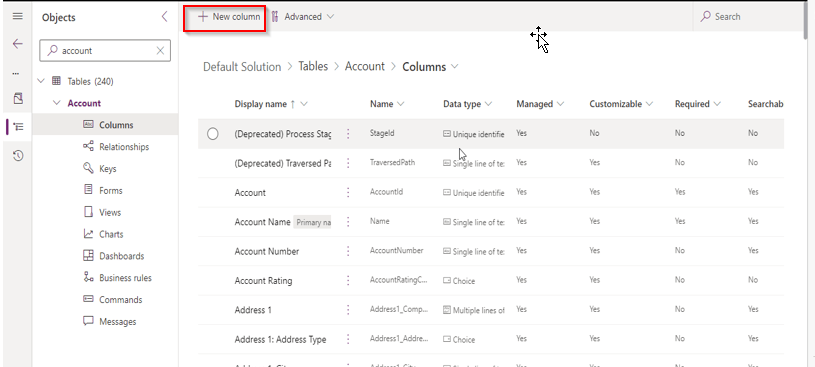
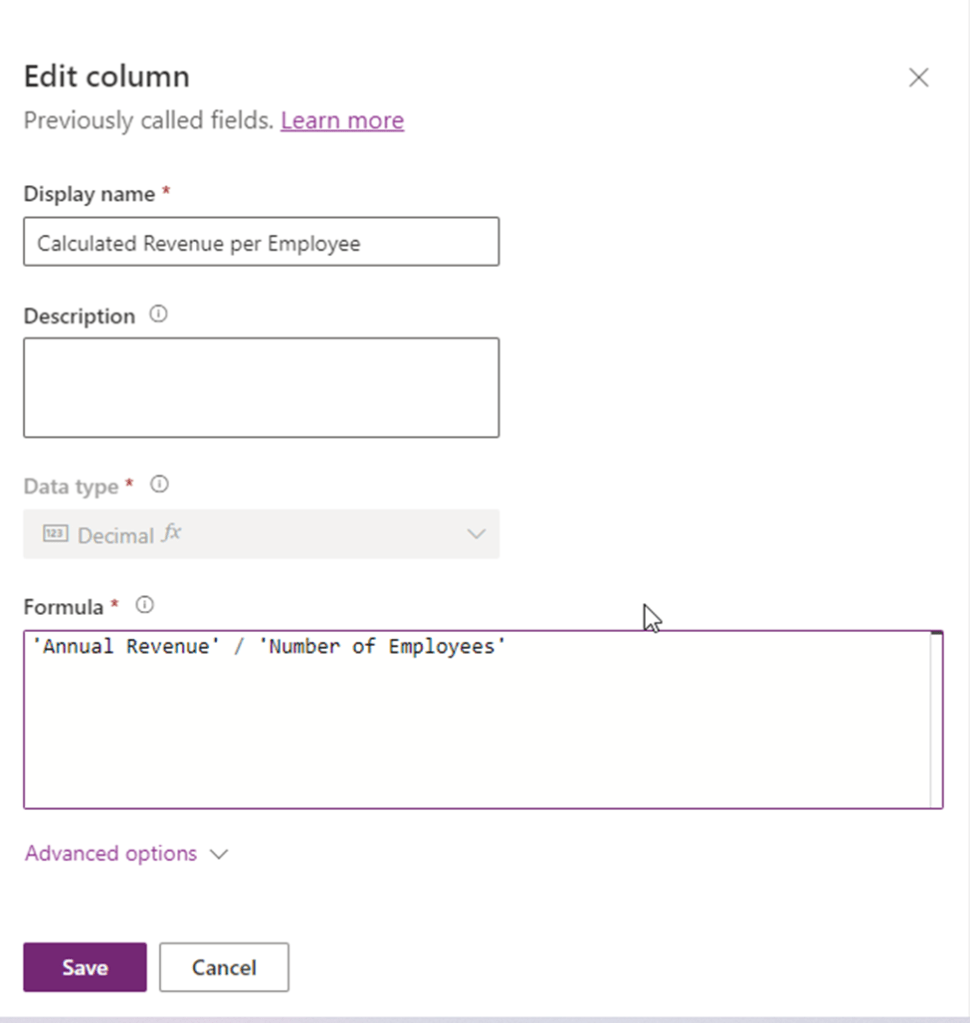
Now create new column as below
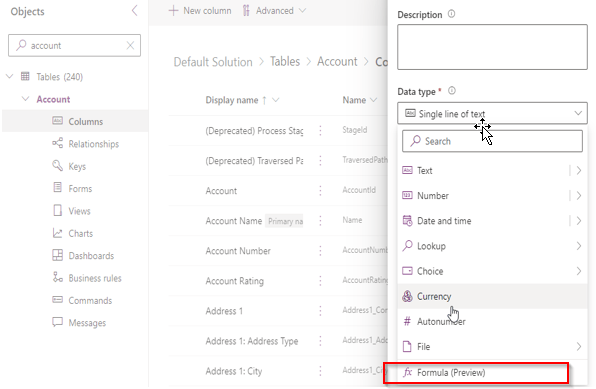
Key values for the field, make a note that the data type (Fx) is selected
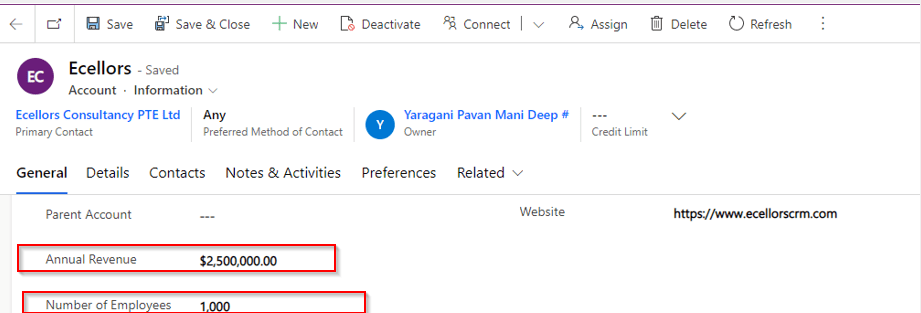
I already have two fields as below already on the form for calculating the Annual revenue per Employee from Annual Revenue of the company…
So now let’s write a simple Power Fx formula to calculate the Annual Revenue per Employee…the expression goes as below…
Annual Revenue is a currency field and Number of Employees field is single line of text. As soon as you save, system automatically identifies the data type as Decimal Number as shown above, click on save and publish the form…
Let’s see the actual use in the form…as soon as you enter the values for Annual Revenue and Number of Employees and save, the value for Calculated Revenue for the Employee field value will be calculated by the Power Fx expression.
Hope this will be useful in future for your implementations…
Points to keep in view:
This formula column is in preview right now at the time of writing this blog post.
And currently, formula columns can’t be used in roll-up fields or with plugins.
You can use the following operators in a formula column: +, -, *, /, %, ^, in, exactin, &
Microsoft Documentation says that the Currency data type isn’t currently supported but it works actually.
The Text and Value functions only work with whole numbers, where no decimal separator is involved
While its been quite sometime since Microsoft shipped the Solution checker and App checker, these tools can help a developer to validate all the solutions that was being built before moving to higher environments. It is always advisable to run solution checker once your solution is developed so this can help you achieve better performance following the Power Platform best practices. Previously we used to send for Code review to senior folks but now with this tool, even the junior developer working at the ground level can easily understand and can make the necessary tweaks in the solution.
Solution Checker serves as a static analysis tool for the developers to check any platform related issues.
The solution checker analyzes these solution components:
Dataverse custom workflow activities
Dataverse web resources (HTML and JavaScript)
Dataverse configurations, such as SDK message steps
Note: Solution checker won’t analyze plugins in solutions. Plugin validations are modernized and will eventually the focus is on the native plugin authoring time, which will help you detect and fix issues earlier. So if you were looking for improvements in Plugin code, this will not help you.
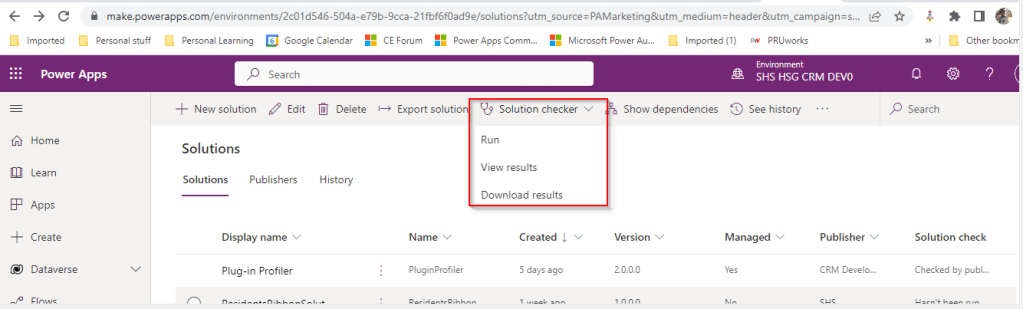
Once solution checker starts running, it will be shown as below with a loading symbol on solution checker
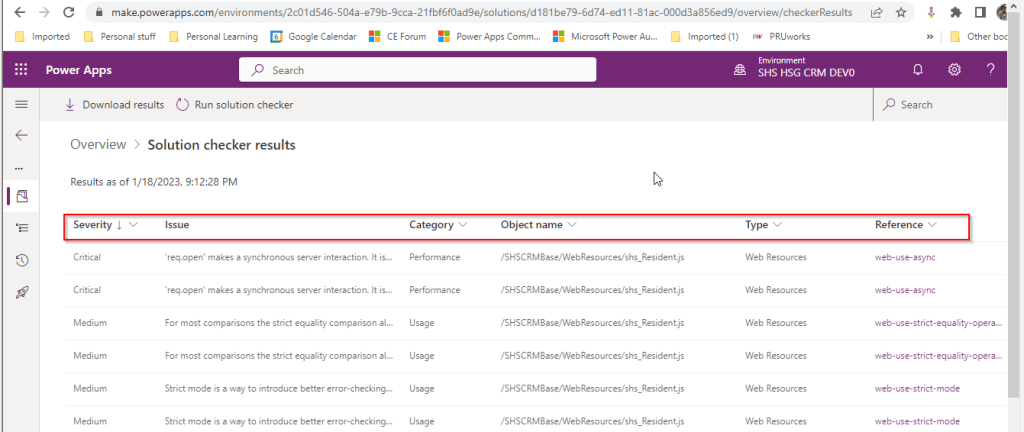
It would take a few minutes to complete the process and will be based on the size of the solution. Once this process is complete, you should be able to download the results or view the results like below
If we open the results file, it shows the potential issues or improvements along with their severity which helps us to prioritize the issues which we need to work upon.
The report can also be downloadable excel file with analysis shipped in Zip format.
Now that we have seen what is solution checker, let’s see what App checker is and its pro’s and con’s.
App Checker:
The App checker is now available to help provide a clear list of formula issues in your app, and to provide items to fix to make your app accessible
This helps to make debugging, performance and best practice decisions an easier and more guided experience.
This is an ideal way to check the formulas you wrote for your Canvas Apps.
There isn’t any possibility to download the app checker results but you can analyze the results on the fly in canvas apps.
To conclude you can think of Solution checker is a tool to check Model Driven Apps and App checker is a tool for Canvas Apps. Hope you will use this great features to improve your solutions and design according to best practices.
This blog post talks all about integration of your Logic apps to your Dynamics CE instance and it’s advantages. Lets get started…
By the way, I can’t redefine the definition provided by Microsoft, so here it goes.
Azure Logic Apps is fully managed integration PaaS service that helps you schedule, automate, orchestrate tasks, business processes, and workflows when you need to integrate apps, data, systems, and services across enterprises or organizations and simplify how you design and build scalable solutions for app integration, data integration, system integration, enterprise application integration (EAI), and business-to-business (B2B) communication, whether in the cloud, on premises, or both. It’s simple to say that you can integrate any system and it is built on a containerized runtime.
Now let’s understand how does the logic apps work:
Every logic app workflow starts with a trigger, which fires when a specific event happens, or when new available data meets specific criteria. Each time that the trigger fires, the Logic Apps engine creates a logic app instance that runs the actions in the workflow. These actions can also include data conversions and flow controls, such as conditional statements, switch statements, loops, and branching. As soon as the Logic App stops running, these resources are discarded.
The interesting part here is that Logic Apps is more developer friendly and can used directly create integrations using logic apps either from Visual studio, Visual Studio Code or browser.
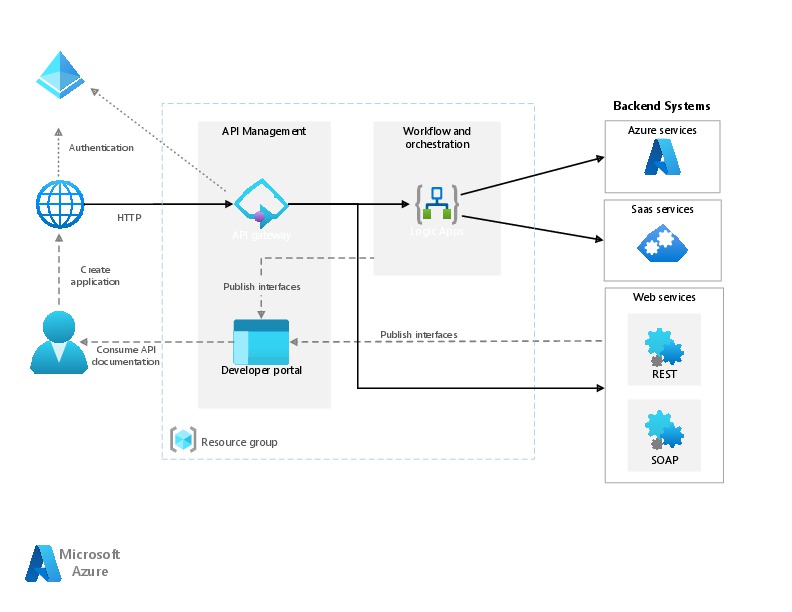
We were given flexibility to choose the type of Logic Apps, Single-tenant and multi-tenant. While creating logic apps, we can use Standard or Consumption based resource type. Logic Apps can create complex orchestrations and it is serverless. This means there is no upfront knowledge required for developer about the infrastructure. You have to bear in mind that it is both a stateful and stateless service unlike Azure Function which is stateless. It allows you to use webhooks as triggers. Coming to the pricing part, the price of Microsoft Azure Logic Apps is inexpensive. Look at it’s architecture below
You can simply edit your Azure logic App in Visual studio code / Visual studio and push your changes to your Devops repository…wow such a easy approach…don’t forget to try it out…
Do let me know if you have any queries or if you can add any more points, do let me know in comments….
That’s it for today…will come back next week with another article in #PowerfulAloneBetterTogether Series.
Recently I was asked by one customer on how they can assess or check the performance of Dynamics CE as they were having some network outages and issues. I remembered that I used a tool earlier for checking my Dynamics CRM On premise engagement. So after checking for online version as well, got to know that we can use in the same way to find the performance for the online CE instance as well. You can follow as below…
To run the Diagnostics tool, you have to follow these steps.
On the user’s computer or device, start a web browser, and sign in to an organization.
The report displays a table with test and benchmark information. Of particular importance is the Latency Test row value. This value is an average of twenty individual test runs. Generally, the lower the number, the better the performance of the client.
In this way you can track your Dynamics CE performance at a given point of time to assess your network latency and bandwidth behaviors.
Have u ever tried creating an App using Azure Cognitive Services.
Here is an excellent video tutorial on how to create an app to Scan Receipts using Azure Cognitive Services Form Recognizer API from MVP @Vivek Bhavishi..


![Power Fx Fomula Data type – your new companion in addition to Calculated fields in Dataverse [Insight]](https://ecellorscrm.com/wp-content/uploads/2023/03/power-fx-template.png?w=1200)