Building a Cloud-Native Power Apps ALM Pipeline with GitLab, Google Cloud Build and PAC CLI: Streamlining Solution Lifecycle Automation

A unique combination to achieve deployment automation of Power Platform Solutions

Hi Folks,

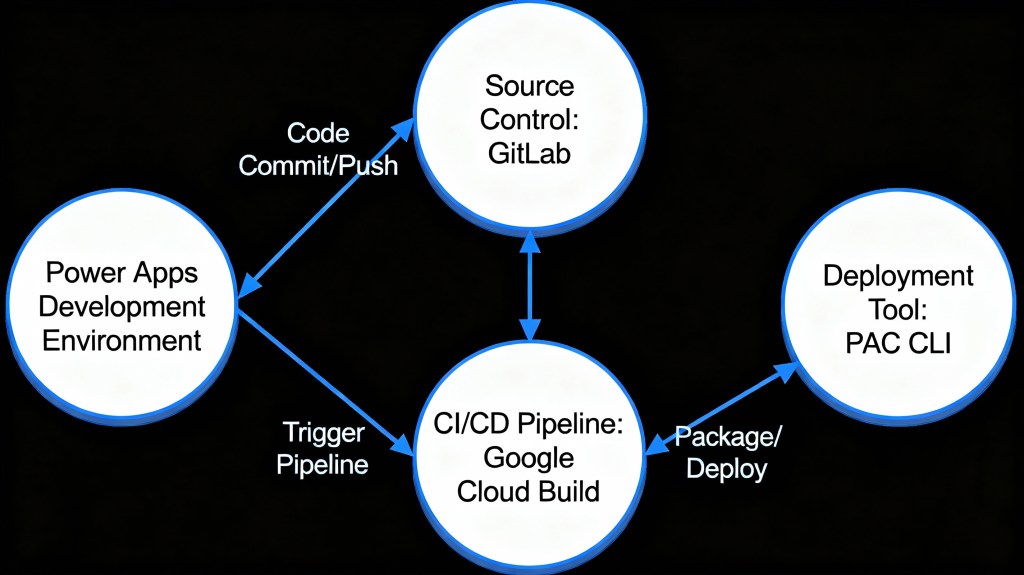
This post is about ALM in Power Platform integrating with a different ecosystem than usual, i.e. using Google Cloud, sounds interesting..? This approach is mainly intended for folks using Google Cloud or GitLab as part of their implementation.

Integrating Google Cloud Build with Power Platform for ALM (Application Lifecycle Management) using GitLab is feasible and beneficial. This integration combines GitLab as a unified DevOps platform with Google Cloud Build for executing CI/CD pipelines, enabling automated build, test, export, and deployment of Power Platform solutions efficiently. This was the core idea for my session on Friday 28 November, at New Zealand Business Applications Summit 2025.

Detailed Steps for this implementation

Create an access token in GitLab for API Access and Read Access

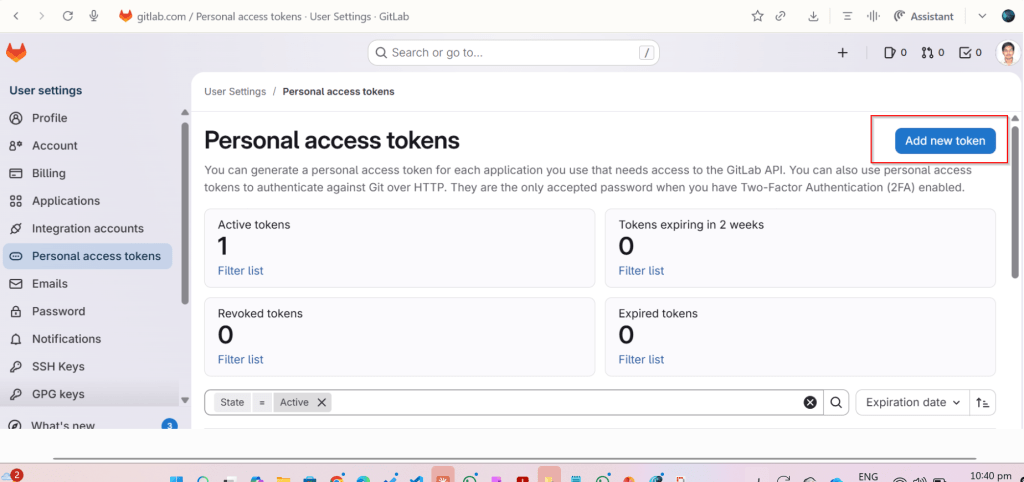
Click on Add new token, you can select at the minimum the below scopes while you were working with CI-CD using GitLab

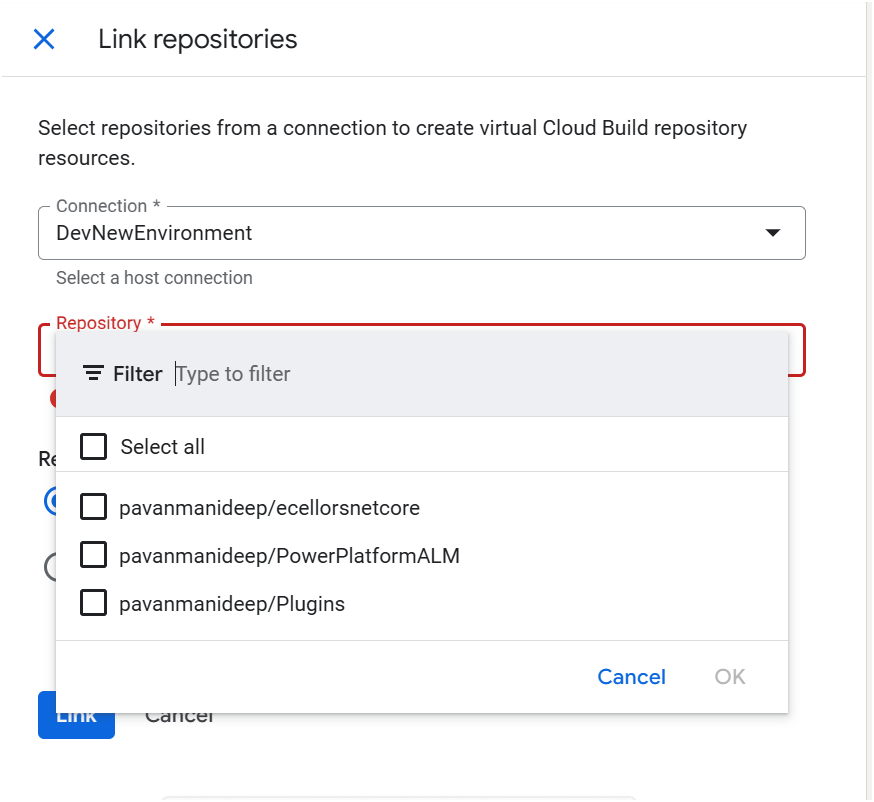
Create a host connection for the repository in GitLab

Specify the personal access token created in the previous step

Link your repository

The created host connections in the previous step will be shown under Connec ctions drop down

Create Trigger in Google Cloud Build

Click on Create trigger above, provide a name, select a nearest region
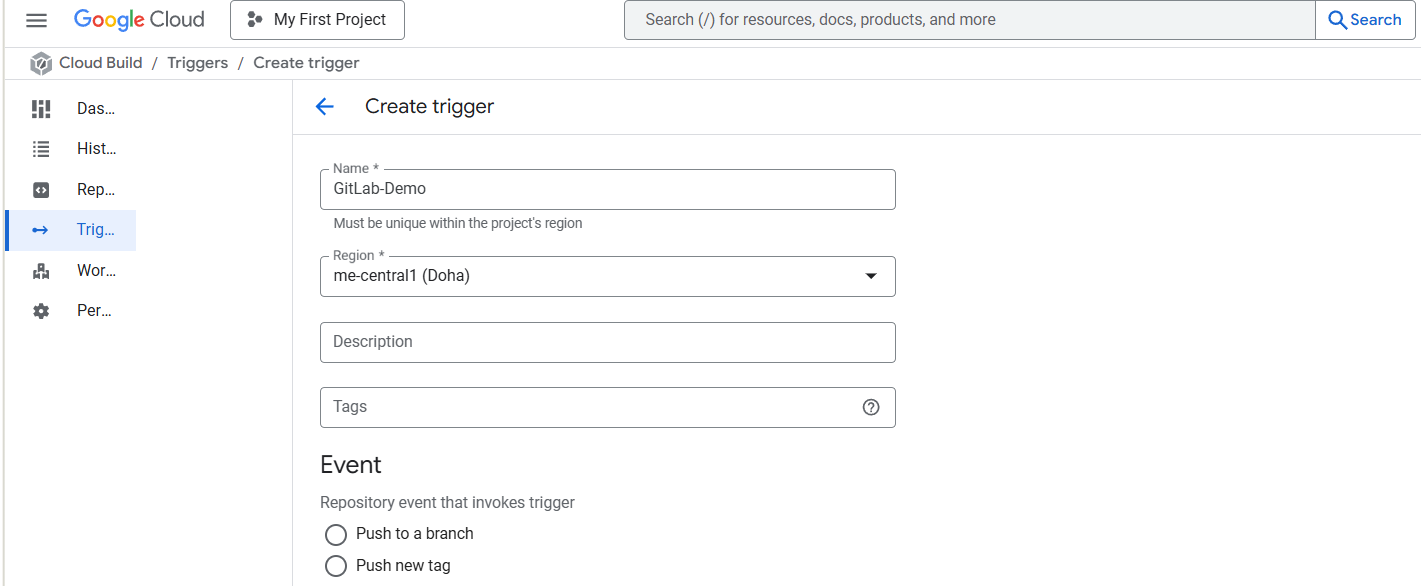
Event:

For now, I am choosing Manual invocation for illustration

Specify where the name of the Repository where your YAML in GitLab resides

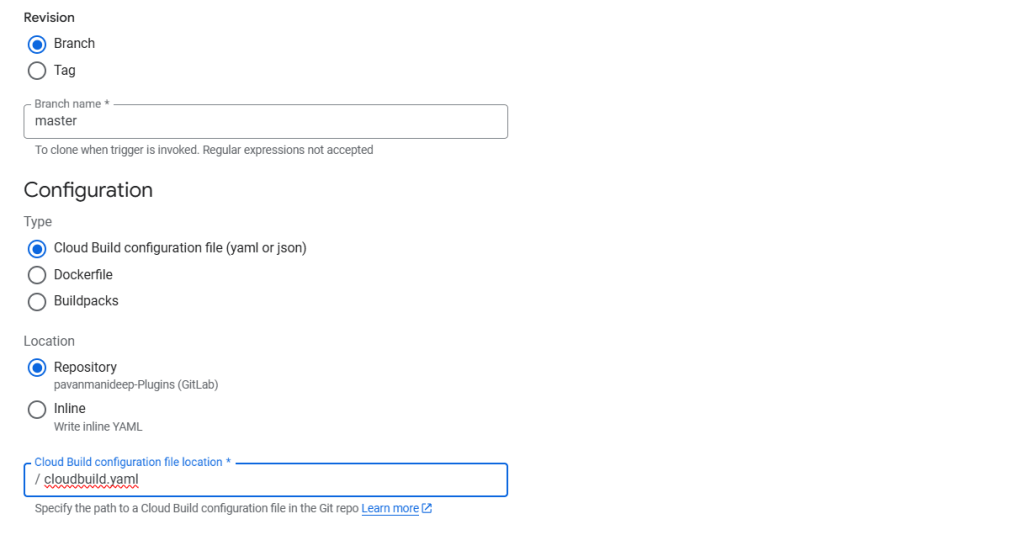
You can optionally specify the substitution variables which are nothing but parameters you can pass to your pipeline from Google Cloud Build Configuration

You can optionally give this for any approval and choose the service account tagged to your google account in the drop down.
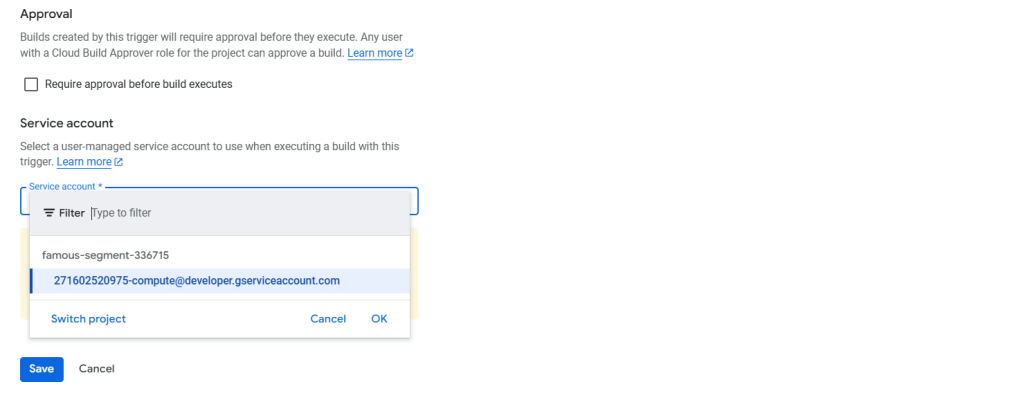
Click on Save.

Next proceed to GitLab YAML

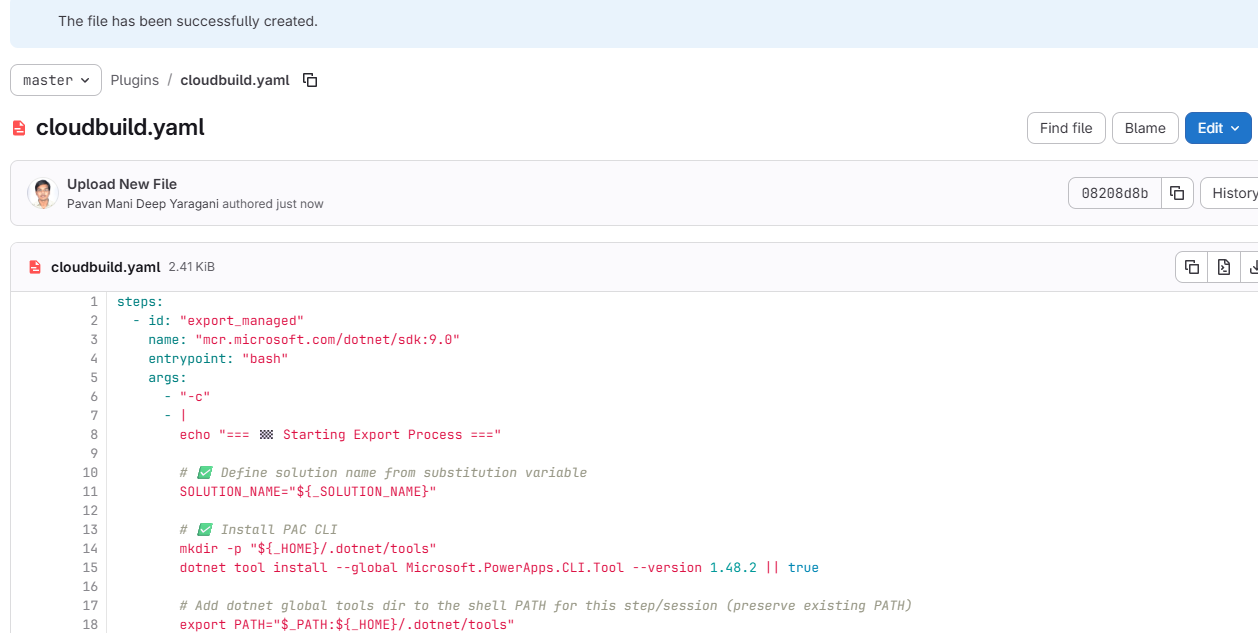
You can find the full code below

steps:
– id: "export_managed"
name: "mcr.microsoft.com/dotnet/sdk:9.0"
entrypoint: "bash"
args:
– "-c"
– |
echo "=== 🏁 Starting Export Process ==="
# ✅ Define solution name from substitution variable
SOLUTION_NAME="${_SOLUTION_NAME}"
# ✅ Install PAC CLI
mkdir -p "${_HOME}/.dotnet/tools"
dotnet tool install –global Microsoft.PowerApps.CLI.Tool –version 1.48.2 || true
# Add dotnet global tools dir to the shell PATH for this step/session (preserve existing PATH)
export PATH="$_PATH:${_HOME}/.dotnet/tools"
echo "=== 🔐 Authenticating to Power Platform Environment ==="
pac auth create –name "manual" –url "https://ecellorsdev.crm8.dynamics.com" –tenant "XXXXX-XXXX-XXXXX-XXXXXX-XXXXX" –applicationId "XXXXXXXXXXXXXX" –clientSecret "XXXXXXXXXXXXXXXX"
pac auth list
echo "=== 📦 Exporting Solution: ${_SOLUTION_NAME} ==="
pac solution export \
–name "${_SOLUTION_NAME}" \
–path "/tmp/${_SOLUTION_NAME}.zip" \
–managed true \
–environment "${_SOURCE_ENV_URL}"
echo "=== ✅ Solution exported to /tmp/${_SOLUTION_NAME}.zip ==="
echo "=== 🔐 Authenticating to Target Environment ==="
pac auth create \
–name "target" \
–url "https://org94bd5a39.crm.dynamics.com" \
–tenant "XXXXXXXXXXXXXXXXXXXXXXXX" \
–applicationId "XXXX-XXXXX-XXXXX-XXXXXX" \
–clientSecret "xxxxxxxxxxxxxxxxxxxx"
echo "=== 📥 Importing Solution to Target Environment ==="
pac solution import \
–path "/tmp/${_SOLUTION_NAME}.zip" \
–environment "${_TARGET_ENV_URL}" \
–activate-plugins \
–publish-changes
echo "=== 🎉 Solution imported successfully! ==="
options:
logging: CLOUD_LOGGING_ONLY
substitutions:
_SOLUTION_NAME: "PluginsForALM_GitLab"
_SOURCE_ENV_URL: "https://org.crm.dynamics.com"
_TARGET_ENV_URL: "https://org.crm.dynamics.com"
_TENANT_ID: "xxxxxxxx-xxxx-xxxx-xxxx-xxxxxxxxxxxx"
_CLIENT_ID: "xxxxxxxx-xxxx-xxxx-xxxx-xxxxxxxxxxxx"
_CLIENT_SECRET: "xxxxxxxxxxxxxxxxxxxxxxxxxxxx"
_SOLUTIONS_DIR: "/workspace/Plugins/08112025"
view raw GitLabDemo.yaml hosted with ❤ by GitHub

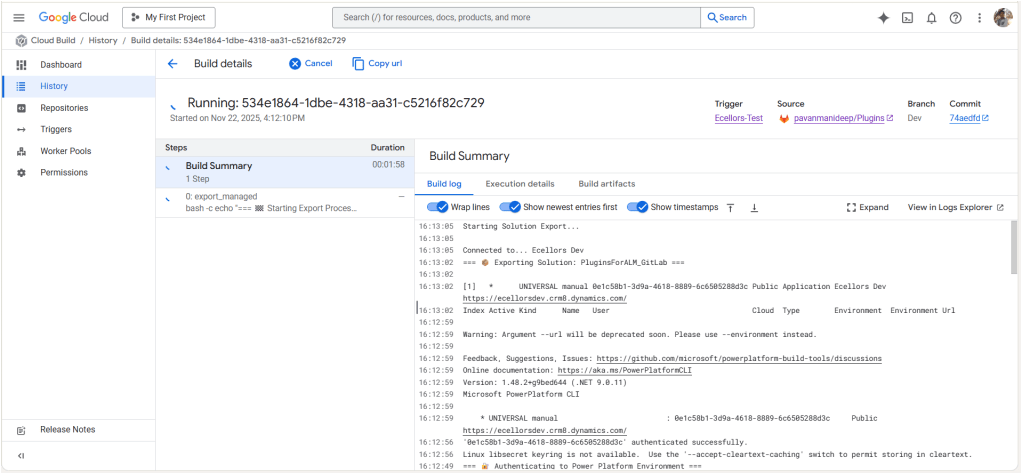
Solution from Source Environment

Now lets run the trigger which will export the solution from the source environment and import to the target environment….we have manual trigger, automatic trigger whenever there is an commit to the repo in GitLab etc., you may pick whatever suits your needs best.

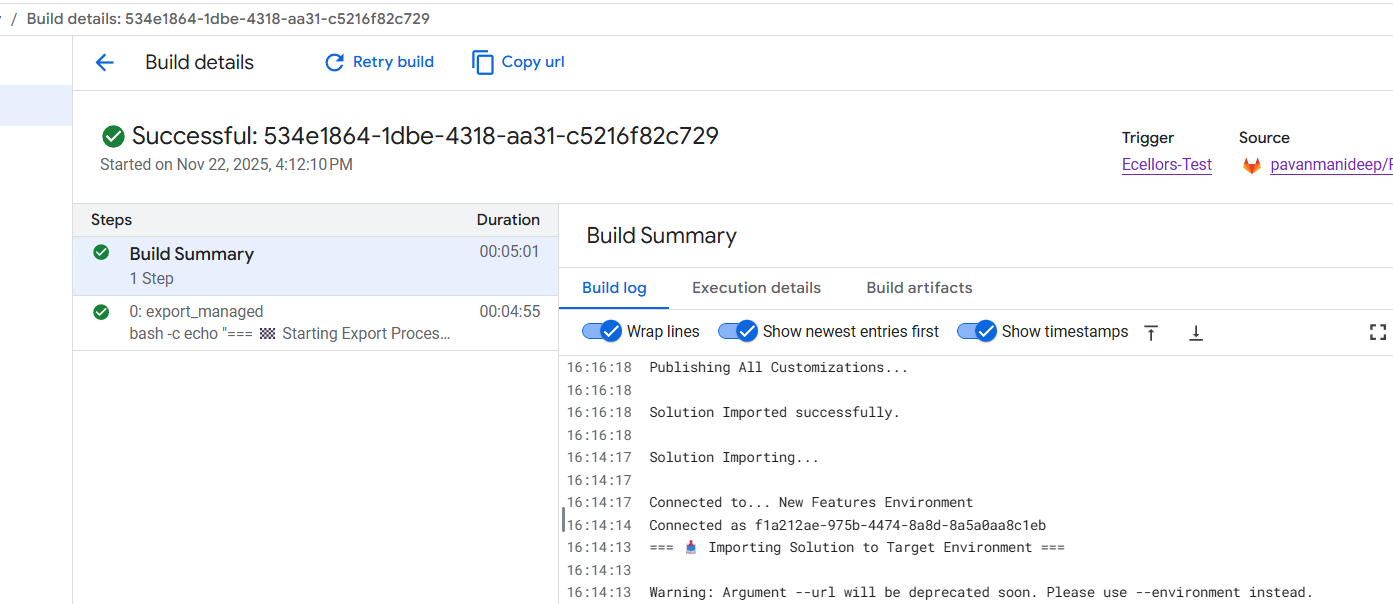
Solution imported to the target environment using Google Cloud Build

The below table illustrates key differences between Google Cloud Build and Azure Devops….

AspectGoogle Cloud BuildAzure DevOps Build Pipelines
Pricing ModelPay-as-you-go with per-second billingPer-minute billing with tiered pricing
Cost OptimizationSustained use discounts, preemptible VMsReserved capacity and enterprise agreements
Build EnvironmentServerless, container-native, managed by Google CloudRequires self-hosted or paid hosted agents
Free TierAvailable with build minutes and creditsAvailable but more limited
Operational OverheadLow, no need to manage build agentsHigher, managing agents or paying for hosted agents
Ideal ForVariable, short, or containerized workloadsLarge Microsoft-centric organizations
Integration Cost ImpactTightly integrated with Google Cloud serverless infrastructureIntegrated with Microsoft ecosystem but may incur additional licensing costs

Conclusion:

PAC CLI is a powerful command-line tool that automates authentication, environment, and solution management within Power Platform ALM, enabling consistent and repeatable deployment workflows. It integrates smoothly with DevOps tools like GitLab and Google Cloud Build, helping teams scale ALM practices efficiently while maintaining control and visibility over Power Platform environments. Just note, my intention was showcase the power of PAC CLI with wider ecosystem, not only with Microsoft.

Cheers,

PMDY

Power Platform Solution Blue Print Review – Quick Recap

The Solution blueprint review is covers all required topics. The workshop can also be conducted remotely. When the workshop is done remotely, it is typical to divide the review into several sessions over several days.

The following sections cover the top-level topics of the Solution blueprint review and provide a sampling of the types of questions that are covered in each section.

Program strategy

Program strategy covers the process and structures that will guide the implementation. It also reviews the approach that will be used to capture, validate, and manage requirements, and the plan and schedule for creation and adoption of the solution.

This topic focuses on answering questions such as:

  • What are the goals of the implementation, and are they documented, well understood, and can they be measured?
  • What is the methodology being used to guide the implementation, and is it well understood by the entire implementation team?
  • What is the structure that is in place for the team that will conduct the implementation?
  • Are roles and responsibilities of all project roles documented and understood?
  • What is the process to manage scope and changes to scope, status, risks, and issues?
  • What is the plan and timeline for the implementation?
  • What is the approach to managing work within the plan?
  • What are the external dependencies and how are they considered in the project plan?
  • What are the timelines for planned rollout?
  • What is the approach to change management and adoption?
  • What is the process for gathering, validating, and approving requirements?
  • How and where will requirements be tracked and managed?
  • What is the approach for traceability between requirements and other aspects of the implementation (such as testing, training, and so on)?
  • What is the process for assessing fits and gaps?

Test strategy

Test strategy covers the various aspects of the implementation that deal with validating that the implemented solution works as defined and will meet the business need.

This topic focuses on answering questions such as:

  • What are the phases of testing and how do they build on each other to ensure validation of the solution?
  • Who is responsible for defining, building, implementing, and managing testing?
  • What is the plan to test performance?
  • What is the plan to test security?
  • What is the plan to test the cutover process?
  • Has a regression testing approach been planned that will allow for efficient uptake of updates?

Business process strategy

Business process strategy considers the underlying business processes (the functionality) that will be implemented on the Microsoft Dynamics 365 platform as part of the solution and how these processes will be used to drive the overall solution design.

This topic focuses on answering questions such as:

  • What are the top processes that are in scope for the implementation?
  • What is currently known about the general fit for the processes within the Dynamics 365 application set?
    • How are processes being managed within the implementation and how do they relate to subsequent areas of the solution such as user stories, requirements, test cases, and training?
    • Is the business process implementation schedule documented and understood?
    • Are requirements established for offline implementation of business processes?

Based on the processes that are in scope, the solution architect who is conducting the review might ask a series of feature-related questions to gauge complexity or understand potential risks or opportunities to optimize the solution based on the future product roadmap.

Application strategy

Application strategy considers the various apps, services, and platforms that will make up the overall solution.

This topic focuses on answering questions such as:

  • Which Dynamics 365 applications or services will be deployed as part of the solution?
  • Which Microsoft Azure capabilities or services will be deployed as part of the solution?
  • What if new external application components or services will be deployed as part of the solution?
  • What if legacy application components or services will be deployed as part of the solution?
  • What extensions to the Dynamics 365 applications and platform are planned?

Data strategy

Data strategy considers the design of the data within the solution and the design for how legacy data will be migrated to the solution.

This topic focuses on answering questions such as:

  • What are the plans for key data design issues like legal entity structure and data localization?
  • What is the scope and planned flow of key master data entities?
  • What is the scope and planned flow of key transactional data entities?
  • What is the scope of data migration?
  • What is the overall data migration strategy and approach?
  • What are the overall volumes of data to be managed within the solution?
  • What are the steps that will be taken to optimize data migration performance?

Integration strategy

Integration strategy considers the design of communication and connectivity between the various components of the solution. This strategy includes the application interfaces, middleware, and the processes that are required to manage the operation of the integrations.

This topic focuses on answering questions such as:

  • What is the scope of the integration design at an interface/interchange level?
  • What are the known non-functional requirements, like transaction volumes and connection modes, for each interface?
  • What are the design patterns that have been identified for use in implementing interfaces?
  • What are the design patterns that have been identified for managing integrations?
  • What middleware components are planned to be used within the solution?

Business intelligence strategy

Business intelligence strategy considers the design of the business intelligence features of the solution. This strategy includes traditional reporting and analytics. It includes the use of reporting and analytics features within the Dynamics 365 components and external components that will connect to Dynamics 365 data.

This topic focuses on answering questions such as:

  • What are the processes within the solution that depend on reporting and analytics capabilities?
  • What are the sources of data in the solution that will drive reporting and analytics?
  • What are the capabilities and constraints of these data sources?
  • What are the requirements for data movement across solution components to facilitate analytics and reporting?
  • What solution components have been identified to support reporting and analytics requirements?
  • What are the requirements to combine enterprise data from multiple systems/sources, and what does that strategy look like?

Security strategy

Security strategy considers the design of security within the Dynamics 365 components of the solution and the other Microsoft Azure and external solution components.

This topic focuses on answering questions such as:

  • What is the overall authentication strategy for the solution? Does it comply with the constraints of the Dynamics 365 platform?
  • What is the design of the tenant and directory structures within Azure?
  • Do unusual authentication needs exist, and what are the design patterns that will be used to solve them?
  • Do extraordinary encryption needs exist, and what are the design patterns that will be used to solve them?
  • Are data privacy or residency requirements established, and what are the design patterns that will be used to solve them?
  • Are extraordinary requirements established for row-level security, and what are the design patterns that will be used to solve them?
  • Are requirements in place for security validation or other compliance requirements, and what are the plans to address them?

Application lifecycle management strategy

Application lifecycle management (ALM) strategy considers those aspects of the solution that are related to how the solution is developed and how it will be maintained given that the Dynamics 365 apps are managed through continuous update.

This topic focuses on answering questions such as:

  • What is the preproduction environment strategy, and how does it support the implementation approach?
  • Does the environment strategy support the requirements of continuous update?
  • What plan for Azure DevOps will be used to support the implementation?
  • Does the implementation team understand the continuous update approach that is followed by Dynamics 365 and any other cloud services in the solution?
  • Does the planned ALM approach consider continuous update?
  • Who is responsible for managing the continuous update process?
  • Does the implementation team understand how continuous update will affect go-live events, and is a plan in place to optimize versions and updates to ensure supportability and stability during all phases?
  • Does the ALM approach include the management of configurations and extensions?

Environment and capacity strategy

Deployment architecture considers those aspects of the solution that are related to cloud infrastructure, environments, and the processes that are involved in operating the cloud solution.

This topic focuses on answering questions such as:

  • Has a determination been made about the number of production environments that will be deployed, and what are the factors that went into that decision?
  • What are the business continuance requirements for the solution, and do all solution components meet those requirements?
  • What are the master data and transactional processing volume requirements?
  • What locations will users access the solution from?
  • What are the network structures that are in place to provide connectivity to the solution?
  • Are requirements in place for mobile clients or the use of other specific client technologies?
  • Are the licensing requirements for the instances and supporting interfaces understood?

Solution blueprint is very essential for an effective Solution Architecture, using the above guiding principles will help in this process.

Thank you for reading…

Hope this helps…

Cheers,

PMDY

Visualize this view – what this mean to developers and end users…?

Hi Folks,

Have you noticed Visualize this view button in in the app bar of any grid view of Dynamics 365?

Here is a dashboard built within couple of minutes. While this can greatly help end users visualize the data present in the system. So, in this post, let’s understand bit more details about this capability and what are the some of the features which are left behind.

Let’s understand the how’s this is generated along with its capabilities and disadvantages compared to traditional Power BI dashboard both from Developer and end user perspective, please note that this is my understanding..

For Developers:

a. Visualize this view uses a PCF Control which calls the Power BI REST API and then generates the embed token for the report embedding that into an Iframe.

b. Then uses Power BI JavaScript API to handle user interactions with the embedded report such as filtering or highlighting data points.

c. When Power BI first generates your report, it takes a look through your data to identify patterns and distributions and pick a couple of fields to use as starting points for creating the initial set of visuals when data is not preselected.

d. Any changes to the data fields calls the UpdateView of the PCF Control and there by passing the updated data fields to REST API and then displays the visuals.

e. Visuals will be created with both selected and non-selected fields which are the related to the selected fields in the data pane.

For End Users & Developers:

Advantages:

  1. Visuals are generated when no data is selected
  2. Cross Highlighting is possible
  3. Click on the Report to see Personalize this visual option
  4. People with Contributor, Member, or Admin role assigned can save the Report to workspace
  5. Users with no access to Power BI cant view this feature, they can request for free Power BI License
  6. Free License users can save the Report to thier personal workspace
  7. Users get build permission when any role above Contributor is assigned and reshare permission is given
  8. The report will be saved as direct query with SSO enabled and honours dataverse settings
  9. Show data table presents a list of tables if the model comprises of multiple tables.
  10. Able to specify the aggregation for each of the field in the model.

Disadvantages:

  1. Only able to export summarized data from Visuals, you will be able to export the data in table from data table.
  2. Only Visual Level, no page level or report level filters
  3. During these reports creation, the model is configured to use Direct Query with Single Sign On.
  4. Embed a report on a Dataverse form requires modifying the XML of the solution
  5. Report published into the workspace are available to download but downloaded reports will not be able to customize further in Power BI Desktop as it would be built using Native Queries.
  6. If the page is kept ideal for long time or the user navigates to other browser window, the session and report will be lost.

Considerations & Limitations:

  1. Power BI Pro license is required to create these reports
  2. While this is wonderful for end users to visualize the data but this is not an alteranative to building reports using Power BI Desktop.

Hope this helps.

Cheers,

PMDY

Microsoft Power Platform Center of Excellence (CoE) Starter Kit – Core Components – Setup wizard – Learn COE #02

Hi Folks,

This post is continuation to my previous post on COE Starter Kit, if in case you have just landed on this page. I would suggest go here and check out my blog post on introduction to COE Starter Kit.

Important:

Do test out each and every component, rolling out to production without testing as you need to keep in mind that there were many flows which can trigger emails to users which may keep them annoyed.

You need to install the components present in the COE Starter Kit extracted folder in the dedicated environment, preferably Sandbox environment (not in Default environment, so that you can test it out first before moving changes to Production), make sure you have Dataverse installed in the environment. First let’s install the Solutions and later we can proceed to customize them.

Install CenterofExcellenceCoreComponents managed solution from your extracted folder, the exact version may be different and differ as the time goes at the time of installing this, the version was as below CenterofExcellenceCoreComponents_4.24_managed

Then proceed to click on Import as we will be configuring these environment variables whenever required later. It takes a couple of seconds to process, it asks to set the connections which I had talked about in previous post, just create new connection if one not available and click next. Make sure you have green checkboxes for each connection, and you are good to click next.

Then you will be presented with the screen to input Environment variables as below, we will configure later so for now, just proceed by clicking on Import button.

The import process may take a while like around 15 minutes, once imported, you should see a notification message on your screen something like below.

Step 1:

You will have a bunch of Apps, Flows installed in your environment. Configure the COE Settings by opening the Centre of Excellence setup and upgrade wizard from the installed Center of Excellence – Core Components managed solution.

It should look something like below when opened. You will be presented with some prerequisites

Proceed with this step-by-step configuration, you don’t need to change any of the setting, just proceed by clicking on Next.

Step 2: In this step, you can configure different communication groups to coordinate by creating different personas

You can click on Configure group, choose the group from the drop down and enter the details and click create a group.

Provide a group name and email address without domain in the next steps and proceed to create a group, these were actually Microsoft 365 groups.

Once you have setup, it should show..

However, this step is optional, but for efficient tracking and maximum benefit of COE, it is recommended to set this up.

Step 3: While the tenant Id gets populated automatically. Make sure to select no here instead of yes if you were using Sandbox or Production Environment and configure your Admin email and click Next.

Step 4: Configure the inventory data source.

Tip: In case you were not able to see the entire content in the page, you can minimize the Copilot and press F11 so that entire text in the page would be visible to you.

This is required for the Power Platform Admin Connectors to crawl your tenant data and store them in Dataverse tables. This is similar to how search engines crawl entire internet to show any search results. While Data export is in preview, so we proceed with using Cloud flows.

Click Next.

Step 5:

This step is Run the setup flows, click on refresh to start the process. In the background, all the necessary admin flows will be running. Refresh again after 15 minutes to see all the 3 admin flows are running and collecting your tenant data as below and click Next.

Step 6:

In the next step, make sure you set all the inventory flows to On.

By the way inventory flows are a set of flows that are repeatedly gathering a lot of information about your Power Platform tenant. This includes all Canvas Apps, Model Driven Apps, Power Pages, Cloud Flows, Desktop Flows, Power Virtual Agent Bots, Connectors, Solutions and even more.

To enable them, open the COE Admin Command Center App from Center of Excellence – Core Components Solution. Make sure you turn on all the flows available.

So, after turning on all the flows, come back and check on Center of Excellence Wizard Setup, you should see a message something like below saying all flows have been turned on.

Configure data flows is optional, as we haven’t configured it earlier, this step would be skipped.

Step 7: In the next step, all the Apps came in with Power Platform COE Kit should be shared accordingly based on your actual requirement to different. personas.

Step 8:

This part of the wizard currently consists of a collection of links to resources, helping to configure and use the Power BI Dashboards included in the CoE.

Finish

Once you click Done, you will be presented with more features to setup.

These setups have similar structure but varies a bit based on the feature architecture.

As we got started with setting Starter Kit and had set up the Core Components of the Starter Kit which is important one, now you can keep customizing further, in the future posts, we will see how we can set up Center of Excellence – Governance Components, Center of Excellence – Innovation Backlog. These components are required to finally set up the Power BI Dashboard and use effectively to plan your strategy.

Everyone who’s ever installed or updated the CoE knows how time-consuming it can be. Not just the setup procedure, but also the learning process, the evaluation and finally the configuration and adoption of new features. It’s definitely challenging to keep up with all this. Especially since new features are delivered almost every month. This attempt from me is to try my best to keep it concise, yet making you understand the process.

While such setup wizard is clear and handy resource to get an overview of the CoE architecture and a great starting point for finding any documentation. This simplifies administration, operations, maintenance and may be even customizations.

If you face issues using the COE Starter Kit, you can always report them at https://aka.ms/coe-starter-kit-issues

Hope this helps…. someone setting up COE starter kit…. if you have any feedback or questions, do let me know in comments….

Cheers,

PMDY

Showing multiselect option set from Model Driven Apps in Power BI

Hi Folks,

Well, this post will show you how you can work with multi option sets from Dynamics 365 in Power BI. First of all, you need some basic understanding of Power BI Desktop to follow. However, I made it clear for people with little background to follow and relate to. I scanned through the internet, but I couldn’t find a similar post, hence I am blogging this if it might help someone. I have faced this issue and here is the solution, you don’t need to use XrmToolBox nor Postman nor complex Power Query as many out in internet would suggest.

So, follow with me along, if you were trying show the values in Multi OptionSet from Model Driven Apps in Power BI as below, then this post is absolutely for you.

Practically if we retrieve the value of Multi OptionSet field as shown in the above image. You get something like below in comma separated values.

Now based on use case and the requirement, we need to transform our data, i.e. Split the values into rows or columns using a delimiter, in this case, we use comma as delimiter. Here I am splitting into multiple rows as I need to show the contacts for different option values selected in the record.

Select on the respective field and choose Split Column option available in the ribbon.

Next, you will be presented with Split Column Delimiter Dialog box, you may select the options as below and click on Ok.

Next in the Split Column by Delimiter, choose as below.

Once clicked on Ok, now the Multi OptionSet was changed to Single OptionSet and showing the values in different rows.

We can use Dataverse REST API to get the OptionSet values as below in Power BI, click on Get Data –> Web, enter the below in the URL to get the MultiSelect OptionSet Values –> Load. You can refer here some reference.

https://ecellorshost.crm5.dynamics.com/api/data/v9.2/stringmaps?$filter=attributename%20eq%20%27powerbi_multioptionset%27

Once data is loaded, it should look as below..

So, now click on Close and Apply the transformation to be saved in the model, later create the data model relationships by going to the model view as below between the multiselect OptionSet field in the contact table and string map table.

Once the relationship is established, we can proceed with plotting the visuals in visuals of your choice. For simplicity, used.

Hope this helps someone looking out for such requirement which at least could save couple of seconds.

Cheers,

PMDY

Simplify Power BI Management with Environment Variables

Introduction

Power Platform solutions often rely on dynamic configuration data, like Power BI workspace IDs, report URLs, or API endpoints. Environment variables make it easier to manage such configurations, especially in managed solutions, without hard coding values. This blog will walk you through the steps to update a Power BI environment variable in managed solutions, focusing on the task of switching the workspace to the correct one directly within Power BI integration when working on different environments.

What are Environment Variables in Power Platform?

Before we dive into the steps, let’s quickly cover what environment variables are and their role in solutions:

  • Environment Variables are settings defined at the environment level and can be used across apps, flows, and other resources in Power Platform.
  • They store values like URLs, credentials, or workspace IDs that can be dynamically referenced.
  • In managed solutions, these variables allow for configuration across multiple environments (e.g., development, testing, production).

Why Update Power BI Environment Variables in Managed Solutions?

Updating environment variables for Power BI in managed solutions ensures:

  • Simplified Management: You don’t need to hardcode workspace or report IDs; you can simply update the values as needed.
  • Better Configuration: The values can be adjusted depending on which environment the solution is deployed in, making it easier to scale and maintain.
  • Dynamic Reporting: Ensures that Power BI reports or dashboards are correctly linked to the right workspace and data sources.
  • Best and Recommended: Changing the environment variables and pointing to right workspace is the correct and is best way to point your Power BI Report to respective workspace and recommended by Microsoft.

Prerequisites

Before proceeding with the update, ensure you meet these prerequisites:

  1. You have the necessary permissions to edit environment variables and manage solutions.
  2. The Power BI integration is already set up within your Power Platform environment.
  3. You have a managed solution where the Power BI environment variable is defined.

Steps to Update a Power BI Environment Variable in Managed Solutions

Step 1: Navigate to the Power Platform Admin Center
Step 2: Open the Solution in Which the Environment Variable is Defined
  • Go to Solutions in the left navigation menu.
  • Select the Managed Solution that contains the Power BI environment variable you need to update.
Step 3: Find the Environment Variable
  • In the solution, locate Environment Variables under the Components section.
  • Identify the Power BI environment variable (such as API URL or workspace ID) that you need to modify.
Step 4: Click on Dashboards to Update the Workspace
  • To update the Power BI environment variable related to the workspace, click on Dashboards.
  • Find the existing environment variable tied to the workspace and click to edit it.
  • Here, you’ll see the current workspace configuration for the Power BI resource.
Step 5: Update the Workspace ID
  • In the environment variable settings, you will now change the workspace to the new one.
  • Select the appropriate workspace from the list or manually enter the new workspace ID, ensuring it aligns with the target environment (development, production, etc.).
  • If necessary, update other properties like report or dataset IDs based on your environment needs.
Step 6: Save and Apply Changes
  • After updating the workspace and any other relevant properties, click Save.
  • The environment variable will now reflect the new workspace or configuration.
Step 7: Publish the Solution
  • If you’re using a managed solution, ensure that the updated environment variable is properly published to apply the changes across environments.
  • You may need to export the solution to other environments (like test or production) if applicable.
Step 8: Test the Changes
  • After saving and publishing, test the Power BI integration to ensure that the updated workspace is correctly applied.
  • Check the relevant Power BI reports, dashboards, or flows to confirm that the new workspace is being used.

Best Practices

  • Document Changes: Always document the updates to environment variables, including what changes were made and why.
  • Use Descriptive Names: When defining environment variables, use clear and descriptive names to make it easy to understand their purpose.
  • Cross-Environment Testing: After updating environment variables, test them in different environments (dev, test, prod) to ensure consistency and reliability.
  • Security Considerations: If the environment variable includes sensitive information (like API keys), make sure it’s properly secured.

Conclusion

Updating Power BI environment variables in managed solutions allows you to maintain flexibility while keeping your configurations centralized and dynamic. By following the steps outlined in this blog post, you can efficiently manage workspace IDs and other key configuration data across multiple environments. This approach reduces the need for hardcoded values and simplifies solution deployment in Power Platform.

Cheers,

PMDY

Microsoft Power Platform Center of Excellence (CoE) Starter Kit – Basics – Learn COE #01

Hi Folks,

This is an introductory post, but it’s worth going through where I will be sharing basics about using Centre of Excellence(COE) in Power Platform. Let’s get started.

So, what’s Center of Excellence? COE plays a key role in deriving strategy and move forward in this fast-paced world to keep up with the innovation. Firstly, we may need to ask ourselves few questions…Do your organization have lot of flows, apps and copilots aka power virtual agents? Do you want to effective manage them? Then how you want to move forward…using COE Starter kit is a great choice. It is absolutely free to download, the starter kit is a collection of components and tools which will help to oversee and adopt Power Platform Solutions. The assets part of the CoE Starter Kit should be seen as a template from which you inherit your individual solution or can serve as inspiration for implementing your own apps and flows.

There were some prerequisites before you can install your COE Starter Kit. Many of the medium to large scale enterprise Power Platform implementations should be possessing in their tenant.

  1. Microsoft Power Platform Service Admin, global tenant admin, or Dynamics 365 service admin role.
  2. Dataverse is the foundation for the kit.
  3. Power Apps Per User license (non-trial) and Microsoft 365 license.
  4. Power Automate Per User license, or Per Flow licenses (non-trial).
  5. The identity must have access to an Office 365 mailbox that has the REST API enabled meeting the requirements of Outlook connector.
  6. Make sure you enable the Power Apps Code Components in Power Platform Admin Center
  7. If you want to track unique users and app launches, you need to have Azure App Registration having access to Microsoft 365 audit log.
  8. If you would like to share the reports in Power BI, minimally you require a Power BI pro license.
  9. Setting up communication groups to talk between Admins, Makers and Users.
  10. Create 2 environments, 1 for test and 1 for production use of Starter Kit
  11. Install Creator Kit in your environment by downloading the components from here

The following connectors should be allowed to effectively use data loss prevention policies(DLP)

Once you were done checking the requirements, you can download from the starter kit here.

You can optionally install from App Source here or using Power Platform CLI here.

The kit provides some automation and tooling to help teams build monitoring and automation necessary to support a CoE.

While we saw what advantages are of having COE in your organization and other prerequisites. In the upcoming blog post, we will see how you can install COE starter kit in your Power Platform tenant and set it up to effectively plan your organization resources for highest advantage.

Cheers,

PMDY

INFO.VIEW Data Analysis Expressions (DAX) functions in Power BI Desktop – Quick Review

Hi Folks,

This blog post is all about the latest features released in Power BI Desktop for DAX(Data Analysis Expressions) using DAX Query View.

Do you have the requirement any time to document your DAX functions used in your Power BI Report, then use the DAX query view which introduced new DAX functions to get metadata about your semantic model with the INFO DAX functions.

Firstly, if you were not aware, DAX Query view is the recent addition where we can query the model similar to how the analysts and developers used Power BI Desktop or other 3rd party tools to get the same information earlier. You can access DAX Query view as below in green.

When you navigate to the DAX Query view, key points to note are as below

  1. DAX Queries will be directly saved to your Model when saved from DAX Query View
  2. DAX Query View will not be visible when the Power BI Report is published to the Power BI Service
  3. The results of the DAX will be visible at the bottom of the page as shown below
  4. IntelliSense is provided by default
  5. There were 4 DAX INFO.VIEW Functions introduced as below
  6. List all your Measures using INFO.VIEW.MEASURES()
    This lists down all the measures in your Semantic Model, it also provides the Expression used for the Measure along with which table it was created.

I have selected the whole results of the measures and Copy the results you see see in the table below

Just go to Model View and click Enter Data

You will be shown a screen like this

Just do a Cntrl + V as you have previously copied the table information

That’s it, how easy it was to document all the Measures, similarly you can document all the Meta Data available for the Power BI Report.

That’s it for today, hope you learned a new feature in Power BI Desktop…

Cheers,

PMDY

Filter data with single date slicer when multiple dates in fact table fall in range without creating relationship in Power BI

Hi Folks,

After a while, I am back with another interesting way to solve this type of problem in Power BI. It took increasingly more amount of time to figure out best approach, this post is to help suggest a way of solving differently. This post is a bit lengthy but I will try to explain it in the best way I can.

Here is the problem, I have date fields from 2 fact tables, I have to filter them using a single date slicer which is connected to a calendar table and show the data when any of dates in a particular row falls in the date slicer range. I initially thought this was an easy one and could be solved by creating a relationship between the two fact tables with calendar table, then slice and dice the data as I was able to filter the data with one fact table when connected to calendar table.

I was unable to do that because there were multiple date fields in one fact table and need to consider dates from two tables. I tried to get the value from the slicer using Calculated field since I have do row by row checking. Later understood that, date slicer values can be obtained using a calculated field but those will not be changing when the dates in date slicer is getting changed, this is because the Calculated fields using row context and will only be updated when data is loaded or user explicitly does the refresh. Instead we have to use measure which is calculated by filter context.

The interesting point here is that, if a measure is added to the visual, it returns same value for each row, so a measure shouldn’t be added to a visual as it calculates values on a table level and not at row level, it is ideal if you want to perform any aggregations.

I tried this approach using the great blog post from legends of Power BI(Marco Russo,Alberto Ferrari), but this looked increasingly complex to my scenario and don’t really need to use this, if you still wish to check this out, below is the link to that.

https://www.sqlbi.com/articles/filtering-and-comparing-different-time-periods-with-power-bi/

So, then I tried to calculate the Maximum and Minimum for each row in my fact table using MAXX; MINX functions

MaxxDate = 

VAR Date1 = FactTable[Custom Date1]
VAR Date2 = FactTable[Custom Date2]

RETURN 
MAXX(
    {
        Date1,
        Date2
        
    },
    [Value]
)
MinXDate = 

VAR Date1 = FactTable[Custom Date1]
VAR Date2 = FactTable[Custom Date2]

RETURN 
MAXX(
    {
        Date1,
        Date2
        
    },
    [Value]
)

After merging the two tables into a single one, then create two slicers connected to Maximum Date and Minimum Date for each row. I thought my problem is solved, but it isn’t, since I was only able to filter the dates which have a maximum or minimum value selected in the date slicer, any date value within the date range is being missed.

So I am back to the same situation again

This blog post really helped me get this idea

https://community.fabric.microsoft.com/t5/Desktop/How-to-return-values-based-on-if-dates-are-within-Slicer-date/m-p/385603

Below is the approach I have used,

  1. Create a date table, using the DAX below
Date =
VAR MinDate = DATE(2023,03,01)
VAR MaxDate = TODAY()
VAR Days = CALENDAR(MinDate, MaxDate)
RETURN
ADDCOLUMNS(
Days,
"UTC Date", [Date],
"Singapore Date", [Date] + TIME(8, 0, 0),
"Year", YEAR([Date]),
"Month Number", MONTH([Date]),
"Month", FORMAT([Date], "mmmm"),
"Year Month Number", YEAR([Date]) * 12 + MONTH([Date]) – 1,
"Year Month", FORMAT([Date], "mmmm yyyy"),
"Week Number", WEEKNUM([Date]),
"Week Number and Year", "W" & WEEKNUM([Date]) & " " & YEAR([Date]),
"WeekYearNumber", YEAR([Date]) & 100 + WEEKNUM([Date]),
"Is Working Day", TRUE()
)

2. Here I didn’t create any relationship between the fact and dimension tables, you can leave them as disconnected as below

    3. All you need is a simple measure which calculates if any of the dates in the fact table fall under the slicer date range, here is the piece of code

    MEASURE =
    IF (
    (
    SELECTEDVALUE ( 'Text file to test'[Date] ) > MIN ( 'Date'[Date] )
    && SELECTEDVALUE ( 'Text file to test'[Date] ) < MAX ( 'Date'[Date] )
    )
    || (
    SELECTEDVALUE ( 'Text file to test'[Custom Date1] ) > MIN ( 'Date'[Date] )
    && SELECTEDVALUE ( 'Text file to test'[Custom Date1] ) < MAX ( 'Date'[Date] )
    ) || (
    SELECTEDVALUE ( 'Text file to test'[Custom Date2] ) > MIN ( 'Date'[Date] )
    && SELECTEDVALUE ( 'Text file to test'[Custom Date2] ) < MAX ( 'Date'[Date] )
    )
    ,
    1,
    0
    )

    4. Then filtered the table with this measure value

    That’s it, you should be able to see the table values changing based on date slicer.

    Hope this helps save at least few minutes of your valuable time.

    Cheers,

    PMDY

    How do you deal with overlapping data labels in Power BI…? – Quick Tip

    Hi Folks,

    This post is a tip which I have implemented in my one of my projects which can help to improve your Power BI Reports accessibility.

    Enabling data labels is a great way to show the numbers in the visual

    But what if they keep overlapping even though you ensured optimal size and Data labels to be displayed at the Outside end like below. It decreases the report accessibility.

    There were two options for you…

    1. Changing the colors in the theme color

    You can change the themes by going to View option if you would like to install the ones available with Power BI, else if you want to install custom themes, you can download them from https://powerbi.tips/ and install.

    After changing the theme color, the data label is clear and readable and thereby increasing accessibility.

    2. Enable background color and set the transparency

    This is the other option where you can enable the background for the data labels and set the transparency based on your requirement, it is good to set that to a low number as below.

      There it is, now your report looks a lot better for users to read the data labels

      Hope this helps someone trying to improve the readability and accessibility of the Power BI Report using the tooltips..

      Cheers,

      PMDY