Geo Migration is a great feature/flexibility offered by Microsoft for customers who wish to move to a region which is in closest proximity to their operations even though initially their Power Platform environment region based out of a different one when they signed up. I checked out online but couldn’t find a good reference blog article yet online, hence this post.
I will make this post detailed but a comprehensive one for anyone to understand the migration. Customers can also opt for Multi Geo for those who have a need to store data in multiple geographies to satisfy their data residency requirements. If you don’t know where your Power Platform environment resides, you can check from Power Platform Admin Center.
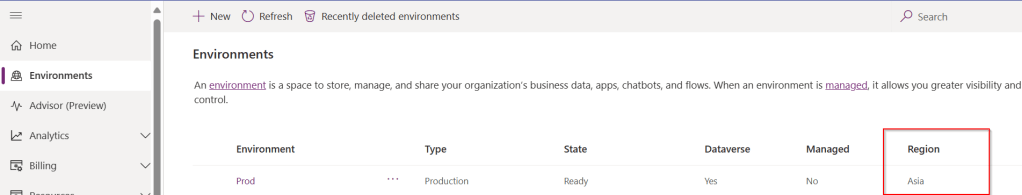
If you were not aware yet, Microsoft Azure is the only cloud provider which offers services in more regions when compared to AWS (Amazon Web Services) and GCP (Google Cloud Platform). The Geo Migration feature seamlessly allows customers to move their environments in a single tenant from one region to another. e.g. for Singapore, it is as below.

Important:
- Geo Migration is not generally available, so please exercise with caution.
- You may reach out to your TAM(Microsoft Technical Account Manager) quoting your request
- There were several limitations, see below references for more details.
Mandatory Pre-Migration Check list:
- Any Power Apps, Power Automate Flows should be manually exported prior to the migration. Custom Connectors aren’t supported as of now, they must manually reconfigure or created in the new environment. You can export them individually or export them in group.
- Canvas Apps, Custom Pages, Code Components like PCF and libraries should be deleted from the environment before your migration activity starts. Else they might be in corrupted state after migration activity.
- If any of your Apps are not solution aware because of any reason like App calls a Power Automate when a button is called etc., you may need to explicitly export it out and take the backup.
Post Migration Check list:
- After the migration, import all the packages which you have taken backup during pre migration. For those which were not solution aware, import them manually.
- If you have Power Portals or Power Virtual Agents, those should be exported explicitly.
- Make sure you test all functionalities in order not to impact end users.
Notes:
You don’t need to build Apps and Flows from scratch. Dynamics 365 marketing App is not supported yet. There could be some configuration changes post migration.
While I try to put the information to the best available as per sources from Microsoft, this may change over time and variation could be different as each customer will have different workloads and dependencies with other services, so please read the references carefully before proceeding. Contact Microsoft Support or TAM as necessary.
Hope this helps to get a sneak peek into the migration process.
References:
Dynamics 365 & Power Platform new regions
Advance Data Residency Move Program
Cheers,
PMDY


![Design your Data Model efficiently with Star Schema for Power BI – [Must Know]](https://ecellorscrm.com/wp-content/uploads/2023/04/power-bi-star-schema-page-image.png?w=922)