Last week Microsoft Power CAT Team had released a white paper on Power Automate Best Practices which is mainly for Power Automate Developers who want to scale up their Power Automate Flows in enterprise implementations.
It has been extremely useful and insightful, so I thought of sharing with everyone again.
This blog post isn’t about any use case, rather it just highlights the importance and benefits of designing your data model for your reporting requirements. Every Power BI Developer should consider this at first place.
When designing your Power BI Reports, Data Modelling is the first step whenever you want to work with the Power BI dashboards or reports which plays a very key role. Coming to Schemas, I can say there are two schemas namely Star Schema and Snow Flake Schema. This blog post mainly talks about Star Schema for your Power BI Report/Dashboard design.
With Star Schema, Power BI data models are optimized for performance and usability. While every consultant try to create stunning visuals, they also need to focus on their data model before spending time on their report design.
Star Schema revolves around 2 types of tables in general, they were Fact tables and Dimension tables(talks about the business entities).
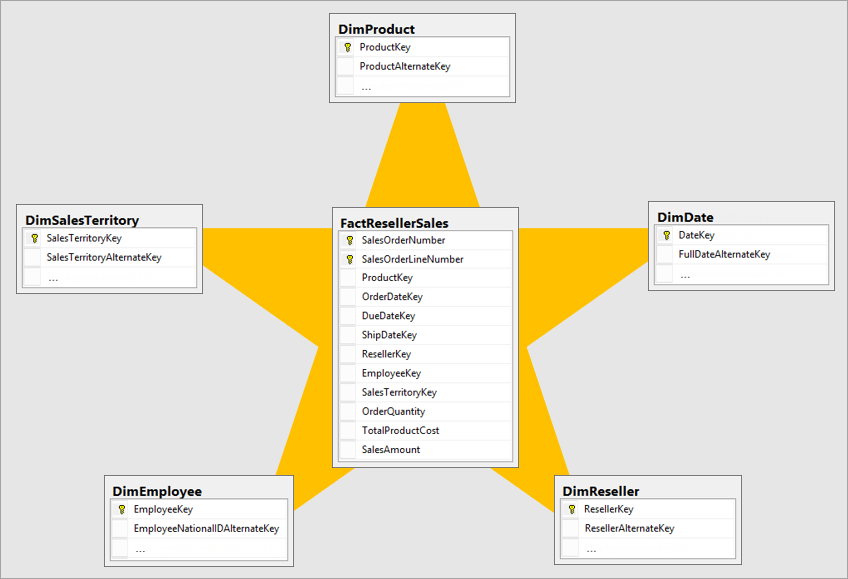
Fact table is central table in star schema. Dimension table are the tables which were connected to Fact table using a one-to-many or many-to-one relationship. Generally, dimension tables contain a relatively small number of rows. Fact tables, on the other hand, can contain a very large number of rows and continue to grow over time. So now let’s see how a star schema looks like and taken from Adventure works sample.
Main point to note here is Normalization and Denormalization capabilities which are two great concepts to understand how star schema can help increase the performance of your dataset.
Star schema requires normalized tables and SnowFlake Schema needs denormalized tables. The design fits well with star schema principles:
Dimension tables support filtering and grouping
Fact tables support summarization
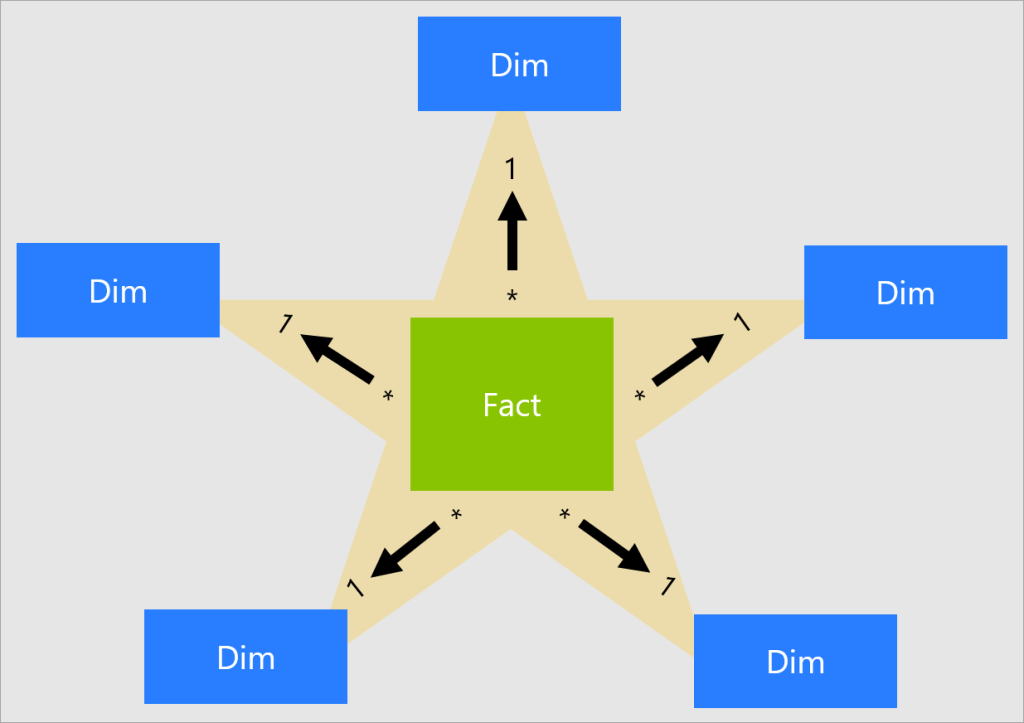
You can visualize the relationship as per the below diagram…
These concepts include, I will brief about the below topics which were not widely popular yet must know for designing an efficient Power BI Dataset.
Measures: These are defined on a fact table that is used to summarize the data in Power BI.
Surrogate keys: It is nothing but an Unique Identifier for a particular table

![Design your Data Model efficiently with Star Schema for Power BI – [Must Know]](https://ecellorscrm.com/wp-content/uploads/2023/04/power-bi-star-schema-page-image.png?w=922)