Establishing tenant hygiene with the CoE Starter Kit – Learn COE #04

Hi Folks,

In this blog post, I am going to talk about establishing tenant hygiene using COE Stater kit, in today’s world where there increasing Power Platform demand. Organizations have become mature, that every implementation is now looking for having some kind of governance being established.

If you were some one who want to get some knowledge of implementing governance, you were at right place.

In order to efficiently implement governance, we need to understand the environment strategy, your current implementation has used. Of course if you were looking for some guidance, there were examples of tooling available in the CoE Starter Kit and out-of-the-box capabilities to help CoE teams effectively manage and optimize their Power Platform solutions.

Few key steps to be considered for maintaing this in your environment, so let’s get started…

  1. Define Environment Strategy
  • Assign your admins the Power Platform service admin or Dynamics 365 service admin role.
  • Restrict the creation of net-new trial and production environments to admins
  • Rename the default environment to ‘Personal Productivity’
  • Provision a new Production environment for non-personal apps/flows
  • Define and implement your DLP policies for your environments
  • When establishing a DLP strategy, you may need multiple environments for the same department
  • When establishing your Power Platform environment strategy, based upon your licensing, you may find that you need to provision environments without a Dataverse (previously called Common Data Service) database and also use DLP policies to restrict the use of premium connectors.
  • Establish a process for requesting access or creation of environments
  • Dev/Test/Production environments for specific business groups or application
  • Individual-use environments for Proof of Concepts and training workshops
  • Use a service account to deploy production solutions
  • Reduce the number of shared development environments
  • Share resources with Microsoft Entra Security Groups.

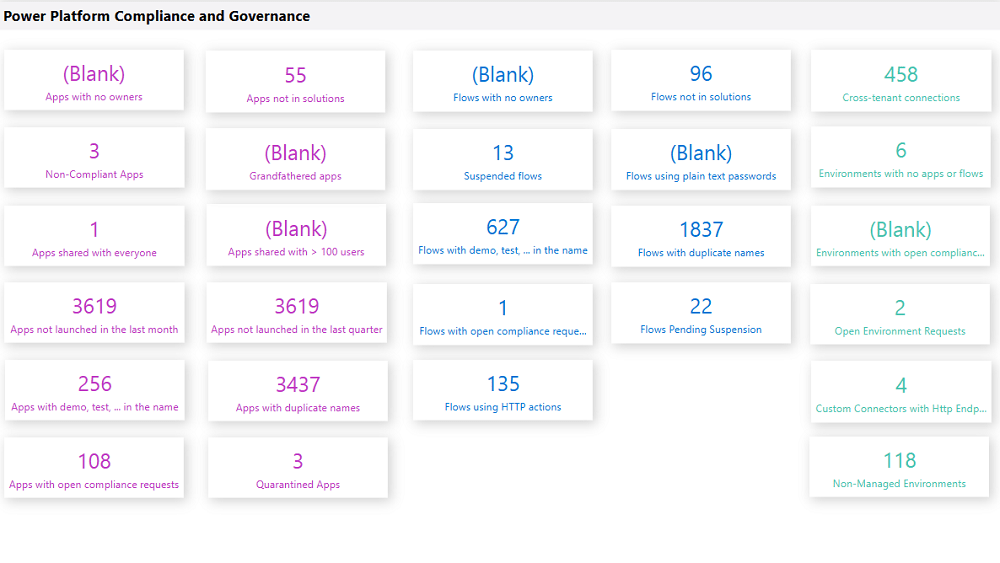
2. Compliance and Adoption:

The Compliance page in the CoE Starter Kit’s Compliance and adoption dashboard can help you identify apps and flows with no owners, noncompliant apps, and suspended flows.

  • Rename and secure the default environment
  • Identify unused apps, pending suspension, suspended cloud flows and not without an owner or not in solutions
  • Quarantined noncompliant apps and clean up orphaned resources
  • Enable Managed Environments and establish a data loss prevention policy
  • Apply cross tenant isolation
  • Assign Administrator roles appropriately
  • Apps and flows with duplicate names not compliant with DLP policies or billing policies
  • Apps shared with everyone and apps shared with more than 100 users and Apps not launched in the last month and in the last quarter
  • Flows using plain text passwords and using HTTP actions
  • Cross-tenant connections
  • Environments with no apps or flows
  • Custom connectors using HTTP environments

3. Managing Dataverse for Teams environments

If you were not using Dataverse for Teams, you can safely skip this step, else please review

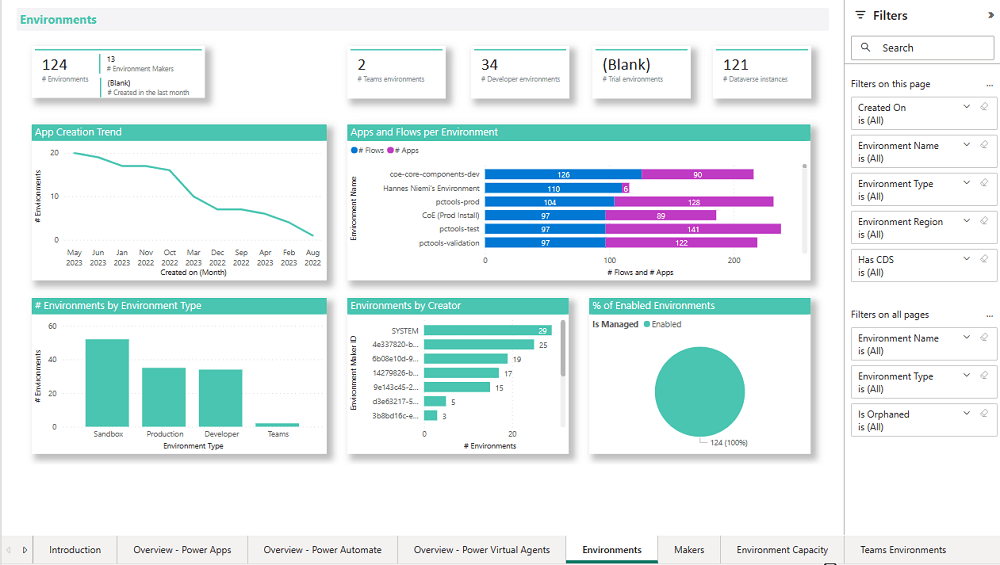
The Microsoft Teams environments page in the CoE Starter Kits dashboard provides you with an overview of your existing Teams environments, apps and flows in those environments, and the last launched date of apps.

Screenshot of a Microsoft Teams Environments overview.

By checking for new Dataverse for Teams environments daily, organizations can ensure they’re aware of all environments in use. 

State of Dataverse for TeamsPower Platform action
83 days after no user activitySend a warning that the environment will be disabled. Update the environment state on the Environments list page and the Environment page.
87 days after no user activitySend a warning that the environment will be disabled. Update the inactive environment state on the Environments list page and the Environment page.
90 days after no user activityDisable the environment. Send a notice that the environment has been disabled. Update the disabled environment state on the Environments list page and the Environment page.
113 days after no user activitySend a warning that the environment will be deleted. Update the disabled environment state on the Environments list page and the Environment page.
117 days after no user activitySend a warning that the environment will be deleted. Update the disabled environment state on the Environments list page and the Environment page.
120 days after no user activityDelete the environment. Send a notice that the environment has been deleted.

Please note a warning is displayed only if the Dataverse for Teams environment is <= 7 days until disablement.
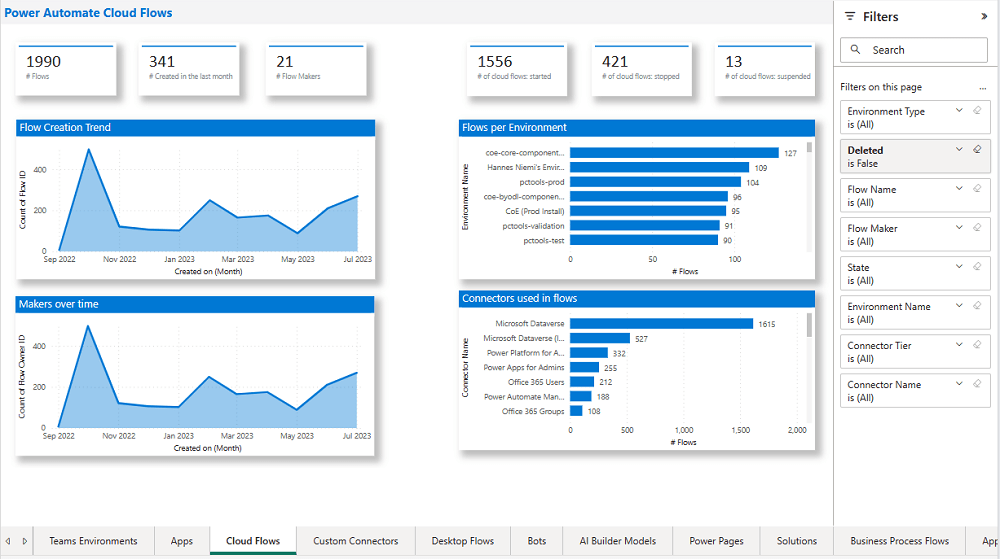
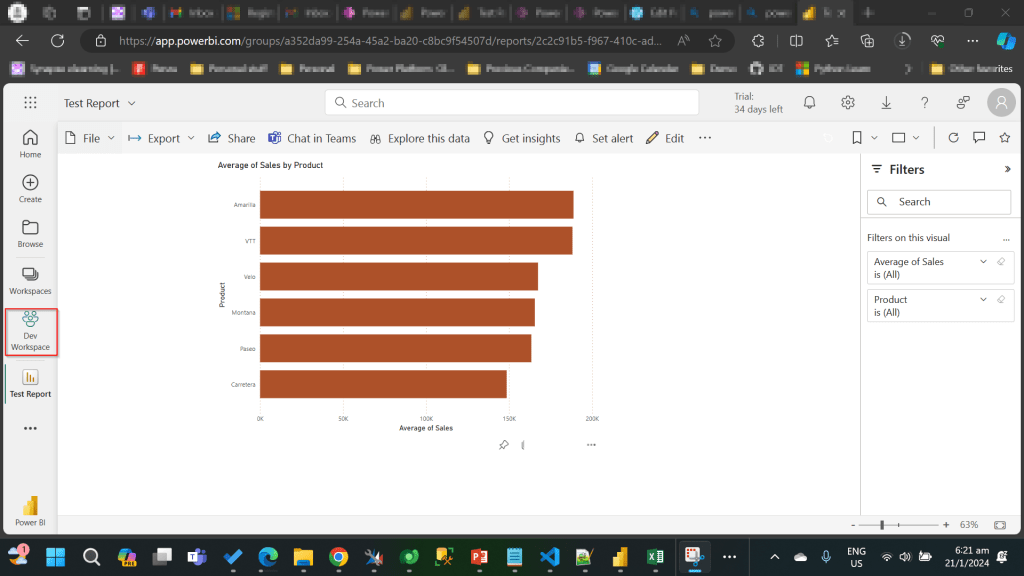
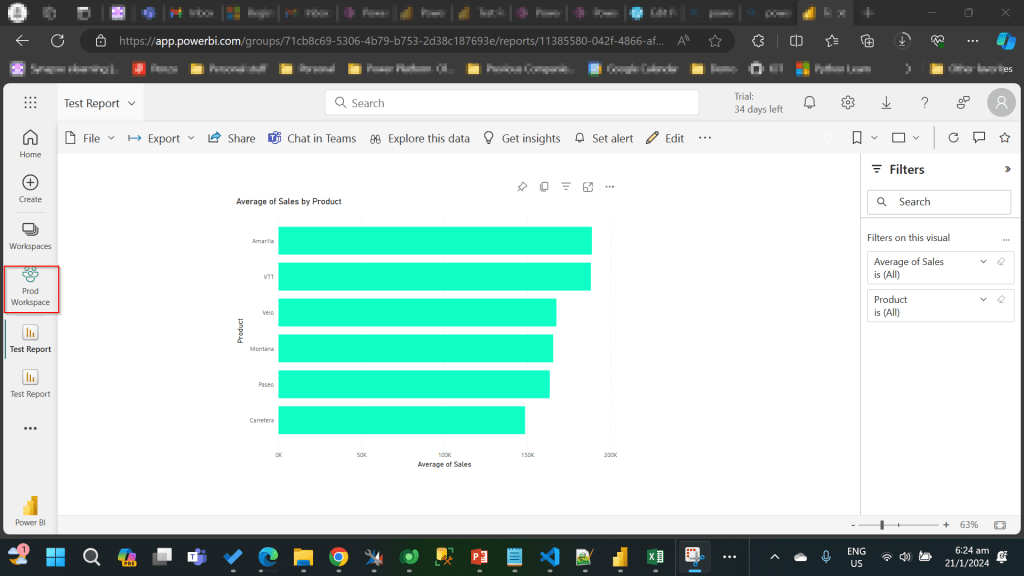
4. Highly used apps

The Power BI Dashboard available out of the box with COE Starter Kit will provide you the necessary guidance over high performing apps and also your most active users.

5. Communicating governance to your makers

This is one of the important step while setting up COE and governance guidelines, follow the below approaches

  • Clearly communicate the purpose and benefits of governance policies:Explain how governance policies protect organizational data
  • Make governance policies and guidelines easily accessible:Place the policies and guidelines in a central location that is easily accessible to all makers
  • Provide training and support:Offer training sessions and resources to help makers understand and comply with governance policies.
  • Encourage open communication: Foster culture where makers can ask questions and raise concerns about governance policies.
  • Incorporate governance into the development process:For example, you can require a compliance review before deploying a solution.

6. Administration of the platform

Power Platform Administrator Planning Tool which comes with COE Strater Kit provides guidance and best practices for administration. Also the planning tool can optimize environments, security, data loss prevention, monitoring and reporting.

6. Securing the environments

It is critical to establish a Data Loss Prevention (DLP) strategy to control connector availability.

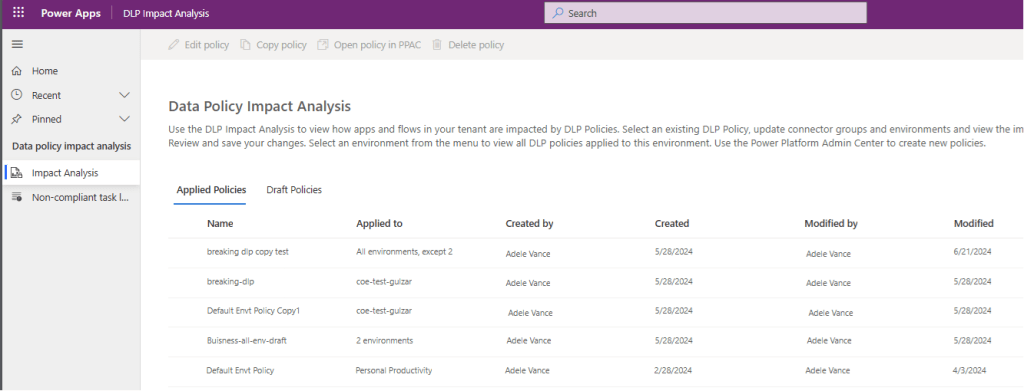
The DLP editor (impact analysis) tool is available for use before making changes to existing policies or creating new DLP policies. It reveals the impact of changes on existing apps and cloud flows and helps you make informed decisions.

Reference: COE Starter Kit Documentation

If you face issues using the COE Starter Kit, you can always report them at https://aka.ms/coe-starter-kit-issues

Hope this helps…. someone maintaining tenant governance with COE starter kit…. if you have any feedback or questions, do let me know in comments….

Cheers,

PMDY

Microsoft Power Platform Center of Excellence (CoE) Starter Kit – Basics – Learn COE #01

Hi Folks,

This is an introductory post, but it’s worth going through where I will be sharing basics about using Centre of Excellence(COE) in Power Platform. Let’s get started.

So, what’s Center of Excellence? COE plays a key role in deriving strategy and move forward in this fast-paced world to keep up with the innovation. Firstly, we may need to ask ourselves few questions…Do your organization have lot of flows, apps and copilots aka power virtual agents? Do you want to effective manage them? Then how you want to move forward…using COE Starter kit is a great choice. It is absolutely free to download, the starter kit is a collection of components and tools which will help to oversee and adopt Power Platform Solutions. The assets part of the CoE Starter Kit should be seen as a template from which you inherit your individual solution or can serve as inspiration for implementing your own apps and flows.

There were some prerequisites before you can install your COE Starter Kit. Many of the medium to large scale enterprise Power Platform implementations should be possessing in their tenant.

  1. Microsoft Power Platform Service Admin, global tenant admin, or Dynamics 365 service admin role.
  2. Dataverse is the foundation for the kit.
  3. Power Apps Per User license (non-trial) and Microsoft 365 license.
  4. Power Automate Per User license, or Per Flow licenses (non-trial).
  5. The identity must have access to an Office 365 mailbox that has the REST API enabled meeting the requirements of Outlook connector.
  6. Make sure you enable the Power Apps Code Components in Power Platform Admin Center
  7. If you want to track unique users and app launches, you need to have Azure App Registration having access to Microsoft 365 audit log.
  8. If you would like to share the reports in Power BI, minimally you require a Power BI pro license.
  9. Setting up communication groups to talk between Admins, Makers and Users.
  10. Create 2 environments, 1 for test and 1 for production use of Starter Kit
  11. Install Creator Kit in your environment by downloading the components from here

The following connectors should be allowed to effectively use data loss prevention policies(DLP)

Once you were done checking the requirements, you can download from the starter kit here.

You can optionally install from App Source here or using Power Platform CLI here.

The kit provides some automation and tooling to help teams build monitoring and automation necessary to support a CoE.

While we saw what advantages are of having COE in your organization and other prerequisites. In the upcoming blog post, we will see how you can install COE starter kit in your Power Platform tenant and set it up to effectively plan your organization resources for highest advantage.

Cheers,

PMDY

INFO.VIEW Data Analysis Expressions (DAX) functions in Power BI Desktop – Quick Review

Hi Folks,

This blog post is all about the latest features released in Power BI Desktop for DAX(Data Analysis Expressions) using DAX Query View.

Do you have the requirement any time to document your DAX functions used in your Power BI Report, then use the DAX query view which introduced new DAX functions to get metadata about your semantic model with the INFO DAX functions.

Firstly, if you were not aware, DAX Query view is the recent addition where we can query the model similar to how the analysts and developers used Power BI Desktop or other 3rd party tools to get the same information earlier. You can access DAX Query view as below in green.

When you navigate to the DAX Query view, key points to note are as below

  1. DAX Queries will be directly saved to your Model when saved from DAX Query View
  2. DAX Query View will not be visible when the Power BI Report is published to the Power BI Service
  3. The results of the DAX will be visible at the bottom of the page as shown below
  4. IntelliSense is provided by default
  5. There were 4 DAX INFO.VIEW Functions introduced as below
  6. List all your Measures using INFO.VIEW.MEASURES()
    This lists down all the measures in your Semantic Model, it also provides the Expression used for the Measure along with which table it was created.

I have selected the whole results of the measures and Copy the results you see see in the table below

Just go to Model View and click Enter Data

You will be shown a screen like this

Just do a Cntrl + V as you have previously copied the table information

That’s it, how easy it was to document all the Measures, similarly you can document all the Meta Data available for the Power BI Report.

That’s it for today, hope you learned a new feature in Power BI Desktop…

Cheers,

PMDY

Seatrium Learning Day – 3 Day Event

Hi Folks,

Excited to share about the recently held AI Innovation Day Bootcamp and Hackathon 2 day event organized by Microsoft, Singapore on September at Seatrium, 80 Tuas S Blvd, Singapore, SG, 6265 1766.

🗣️ Business User Feedback & Reflections

Solutions buit by Seatrium employees based on the engagement and the type, thanks to David Choo, Seatrium Microsoft Technical Account Manager for spearheading this Initiative.

Seatrium management officially sent a thank you note to MVPs Pavan Mani Deep Yaragani, Goloknath Mishra, Senthami Selvan for spending 3 valuable days for this event making it a grand success.

The event took place like below

  1. Day Microsoft Singapore with Seatrium Hackathon Particpants for prepartion on 16 September
  2. AI Innovation Day – 1 – 23 September, 2024.
  3. AI Innovation Day – 2 – 24 September, 2024.
  4. AI Innovation Day – Evaluation and Awards

Below were some the feedback from different business user teams.

🛠️ Operations & Production Team:

“We’ve been struggling with manual job task cards for years—seeing OCR and Copilot Studio digitize it in just two days was mind-blowing!”

“Tracking welder certifications used to take hours each week. Now, with this Power App, we can do it in seconds.”

📦 Supply Chain:

“This predictive maintenance idea using AI was something we thought only big tech could do. I didn’t expect we could prototype it so fast with Azure AI and Power Platform!”

“The Power BI dashboards finally give us a single view of procurement metrics without needing to export Excel sheets all day.”

🏗️ Engineering:

“We’ve been manually cross-checking MTOs and standards forever—having AI do that gives us back our time to actually focus on engineering work.”

“It’s amazing to see a tool extract information from drawings and relate it to VCDs without manual effort.”

💻 Group IT & HR:

“That SharePoint Copilot FAQ bot is going to save us a ton of IT support emails—super impressive.”

“Invoice checking and validation was one of our most time-consuming tasks—now it’s automated and way more reliable.”

📊 Commercial & Planning:

“We finally saw what Microsoft Fabric can do for project-level KPIs and dashboards. We’re excited to explore more.”

“This was one of the most hands-on, practical hackathons we’ve had. It wasn’t just ideas, we actually saw working solutions.”

The teams have worked on the attached use cases:

Fantastic event Pics:

Looking forward to more collaborations with Microsoft for organizing such events in Singapore.

Cheers,

PMDY

Embed Python Visuals in Power BI Desktop – Quick Review

Hi Folks,

This post is all about embedding Python visuals in Power BI, you will need to install the respective dependent libraries like Seaborn, Matplotlib when you were creating visuals as we are using the respective libraries.

Thank you @Dr.S.Gomathi for sharing insights at GPPB Tamil Nadu, 2024, while I don’t know that Power BI has this capability. I am writing this down.

The first thing you need to do is to install Python, you can install the latest version from internet. Click here to Download Python for Windows.

Once downloaded and installed in your local machine, you can find a folder created under your Windows Start menu like below.

You need to right click on Python 3.11(64-bit) icon which is the current latest version and then click on open file location.

Then you will be able to see the contents in the folder

You need again right click on Python 3.11 (64 bit) and open its actual contents where the library files reside.

Copy this path, we need this in a while.

Now open Power BI Desktop and navigate to File –> Options and Settings –> Options

Now in the options and settings, you need to select on the Python scripting and specify the path which you just copied above as below.

Now you were ready to use Python visuals in Power BI.

Next step is to click on Python visual as highlighted below

You will be then asked to enable Python scripts as below

You will need to click on Enable as shown above. Once it is done, you are ready to start using Python visuals in Power BI.

Then you need to load data from your DataSource. Here is the link to the excel I have used. Once data is loaded into your Power BI report, you need to select respective data fields which you want to visualize. Here I am using two fields for X and Y axis, then in Power BI Desktop, you should be able to see something like below.

and in order to effectively visualize the sales trends, I will be visualizing the data using Violin Chart, which is using Seaborn library, while the Seaborn is actually based on Matplotlib library. So, I need to make sure I have those two libraries installed in my machine. You can install by using Command Prompt in your PC, you need to enter below commands and press enter to install.

pip install matplot lib

pip install seaborn

Once installed, we can plot using the below command in the python script tab in Power BI Desktop

# The following code to create a dataframe and remove duplicated rows is always executed and acts as a preamble for your script:
# dataset = pandas.DataFrame(Sales, Country)
# dataset = dataset.drop_duplicates()
# Paste or type your script code here:
import pandas as pd
import seaborn as sns
import matplotlib.pyplot as plt
# Set the aesthetic style of the plots
sns.set_style("whitegrid")
# Create a violin plot for Sales Satisfaction across different Product Categories
plt.figure(figsize=(12, 8))
sns.violinplot(x='Year', y='COGS', data=dataset, palette='muted', split=True)
plt.title('Sales by Product Category')
plt.xlabel('Product Category')
plt.ylabel('Customer Satisfaction Rating')
plt.show()

Then you may need to click on run script as highlighted below

This gives your Violin chart showing the sales distribution for different product categories in your Power BI Desktop. If you were facing any problems viewing the report, check the error in the pop-up message displayed by Power BI, you can also follow the Microsoft article on this mentioned in the references.

Hope this helps someone trying to use Python visuals inside Power BI. Same way, you can use different visualizations available with Python which were not available in Power BI by default.

References:

https://learn.microsoft.com/en-us/power-bi/connect-data/desktop-python-scripts

Cheers,

PMDY

Use environment variable to deploy different version of Power BI Reports across environments in Power Platform

Hi Folks,

Thank you for visiting my blog…in this post, we will see how we can create and manage a Power BI Environment variable in Model driven apps in Power Platform.

So, let’s say, we have two environments 1. Dev 2. Default, we want to deploy export the solution with Power BI report from Dev environment as managed solution and import that to Default environment. The report in Default environment should point to Production workspace in Power BI.

I have the following reports in workspaces.

Development workspace:

Production Workspace:

Now in order to deploy the report to Production, we need to use a managed solution and the report should point to Production workspace. So, in order to handle this, we will need to define an environment variable to store the workspace information. So, let’s get started.

First, we will create a Power BI embedded report in Development environment.

While you were creating a Power BI embedded report, you will be presented an option to choose from the Power BI workspace.

In order to achieve this requirement of deploying different versions of Power BI report in different instances, we need to use environment variable, so check the Use environment variable option.

  1. The environment variable will be specific to this report and should be included in the solution when we want to deploy this report to higher environment.
  2. The next thing to note is that Default workspace would reflect the default value for this report and current value is required when we want to set to another report in a different environment.

In Development environment, we choose as below..

Once the environment variable is saved, we now have 1 Dashboard and 1 environment variable component in the solution.

This solution is published and then exported as Managed solution, imported to another environment (Default environment which serves as Production environment here).

While importing, it asks to update environment variable, you can proceed to click on Import.

Now we have the solution in Default environment.

In order to update the value of the report to consider from Production environment, we need to open the report and click on the Pencil icon besides the Power BI Environment variable.

Then choose Prod workspace and its respective report and click save, publish.

That’s it…

You will be able to see two different reports in your Development and Default instances.

In this way, it is very easy to manage and deploy different versions of Power BI Report to different environments like Dev, Test, Prod.

Hope this helps…

Cheers,

PMDY

Show last refreshed time for your Power BI Reports in Import Mode – Quick Tip

Hi Folks,

If you are working on Power BI, this is a good to know tip.

In case you were using Import mode which is by default suggested by Microsoft for medium or small-scale datasets as it uses Vertipaq engine for improved performance and compression, this post is definitely for you.

Did your user ever asked why they were not able to see latest data in the report. Possibly you could have said it is because of refresh frequency.

Then you could have thought if there was a nice way to show when the dataset was last refreshed. This definitely help your users to have a clear idea of what’s going on.

FYI, the refresh frequency could be set in Power BI service as below for import mode.

In your Power BI report, click on Transform data.

Click on New Source –> Blank Query as below.

In the Query Fx expression…. enter the below expression to get the last refresh time and click on Tick symbol.

Next, click on To Table to create a table from this data as below.

Rename it to something meaningful like below.

Rename the Query1 variable as below..you should see the applied steps getting added for each operation you performed.

DateTime.LocalNow() gets the last refresh frequency of your dataset in your local time.

Click on Close & Apply

Now in your report, just add a card visual at the bottom right corner and drag the Last Refreshed On query.

That’s it, next time onwards, you should see the date and time when the refresh had occurred.

Cheers,

PMDY

Stop using OData V2.0 endpoint going further for your implementations….!

Hi Folks,

This blog is just to let you know why you should stop implementing OData calls using V2.0 version. I am pretty sure almost every Dynamics CE project out there have used this OData calls definitely in their implementations from quite some time. While some of new implementations have replaced the logic using Web API, still some people go with using OData V2.0 calls to build their functionality using JavaScript.

Microsoft had actually planned to remove this endpoint from April 30, 2023. But they deferred this because many projects are’nt yet prepared for removal of this end point and help the customers prepare for this transition to Web API end point.

Identify if you still using OData V2.0 end point, actually Organization Data Service is an OData V2.0 endpoint which was introduced with Dynamics CRM 2011..it’s deprecated way back with Dynamics 365 CE version 8.0.

So now, how to identify where and all you were using OData End Points in your code…you shouldn’t expect that existing code will work with only minor changes and this work can be taken at a later stage. This was a high priority warning message from Microsoft stating the removal, so I urge all of you to be prepared for this removal very soon and you shouldn’t be surprised.

So where to change…..?

Below are the places where you should change your way of implementation and align with Microsoft…

  1. The Organization Data Service using this end point /XRMServices/2011/OrganizationData.svc in Javascript, you can find it out with the help of the checker service rule web-avoid-crm2011-service-odata for identification. This can be code which was making OData calls to perform CRUD Operations on the current table or related table.
  2. Check any other code, including PowerShell scripts, that send requests to this endpoint: /xrmservices/2011/organizationdata.svc.
  3. Cross Check your Power BI reports or Excel Data sources that may be using this endpoint.

Note:

This announcement does not involve the deprecated Organization Service SOAP endpoint, meaning using Organization service in plugins. At this time, no date has been announced for the removal of that endpoint. At the time of writing this blog post, Microsoft didn’t announce whether this removal is only for Online or On Premise Versions.

References:

How to use Application Insights to identify usage of the OrganizationData.svc endpoint?

OData v2.0 Service removal date announcement

The Clock is Ticking on Your Endpoint

Do not use the OData v2.0 endpoint

Hope this saves time and effort implementing your Dynamics CE Solutions…

Cheers,

PMDY

Design your Data Model efficiently with Star Schema for Power BI – [Must Know]

Hi Folks,

This blog post isn’t about any use case, rather it just highlights the importance and benefits of designing your data model for your reporting requirements. Every Power BI Developer should consider this at first place.

When designing your Power BI Reports, Data Modelling is the first step whenever you want to work with the Power BI dashboards or reports which plays a very key role. Coming to Schemas, I can say there are two schemas namely Star Schema and Snow Flake Schema. This blog post mainly talks about Star Schema for your Power BI Report/Dashboard design.

With Star Schema, Power BI data models are optimized for performance and usability. While every consultant try to create stunning visuals, they also need to focus on their data model before spending time on their report design.

Star Schema revolves around 2 types of tables in general, they were Fact tables and Dimension tables(talks about the business entities).

Fact table is central table in star schema. Dimension table are the tables which were connected to Fact table using a one-to-many or many-to-one relationship. Generally, dimension tables contain a relatively small number of rows. Fact tables, on the other hand, can contain a very large number of rows and continue to grow over time. So now let’s see how a star schema looks like and taken from Adventure works sample.

Image shows an illustration of a star schema.

Main point to note here is Normalization and Denormalization capabilities which are two great concepts to understand how star schema can help increase the performance of your dataset.

Star schema requires normalized tables and SnowFlake Schema needs denormalized tables. The design fits well with star schema principles:

  • Dimension tables support filtering and grouping
  • Fact tables support summarization

You can visualize the relationship as per the below diagram…

These concepts include, I will brief about the below topics which were not widely popular yet must know for designing an efficient Power BI Dataset.

Last but not the least, I should say that following and designing your data model using Star Schema is a best practice suggested by Microsoft.

You can lookout for references if you want to see video which can be of great help for you to understand the star schema mainly for beginners…

References:

Star Schema Data Model in Power BI

What is star schema?

Hope this helps…

Cheers,

PMDY

5 Power BI Errors..you often encounter – Fixed

Hi Folks,

Here I would like to give some tips regarding Power BI Errors which will be encountered in everyday job of anyone who’s going to or work with Power BI Dashboards or understand any existing dashboards and integrate them with Model Driven Apps. You aren’t alone…so let’s gets started…

Error 1: Unable to open document

Fix:

You were not on the latest version of Power BI desktop with which it was authored. You can quickly check the version by navigating to Help –> About

You should see a update icon as below

Clicking on it will take you to the respective page having the latest update from where you can update it.

Error 2: Class not registered error

Fix:

This can happen when you were trying to open an existing dashboard which was created by you or shared by someone to you, might be because you have two versions of Power BI Desktop installed..in your machine..like shown below.i.e.

  1. Installed Power BI from Microsoft Store
  2. Installed Power BI from Microsoft Downloads

Make sure you choose the right one which you have used earlier to develop the Dashboard so that you won’t run into any issue.

Error 3: Workspace deleted

Fix:

This error can happen when you were trying to access any workspace while you were creating a Power BI Dashboard in Dynamics CE using an existing workspace, make sure you have a workspace and the logged in user have access to the Workspace.

Granting access to the workspace will fix the issue.

Error 4: One or more Cloud Datasources have been deleted

Fix:

Whenever you deploy any new Power BI report or dashboard to Power BI Service, you encounter this problem most of the times. Sometimes after making a change to a dataset or taking over ownership of a dataset, you might receive the following error:

1. Click the “Recreate cloud data sources” button.

2. Reenter credentials in the “Data Source Credentials” section for your data sources

Make sure dataset is connected to Gateway incase you have configured.

Error 5: There is no gateway to access the datasource

Fix:

The first thing to look at when you have a missing gateway is to make sure you created a data source for that gateway. Installing the On-Premises Data Gateway is not enough. That simply registers the gateway with the Power BI service and lists you as an admin for that gateway.

You then need to go into the Power BI service and create a data source for that gateway.

You can create a data source by doing the following.

  1. Select the gear icon within Power BI
  2. Select Manage Gateways.
  3. Select your gateway and then select Add Data Source.
  4. When you are done entering the information, select Add.

References:

Power BI Start up issues – MS Learn

One or more cloud datasources have been deleted

Restore and Recover Deleted Workspace

Hope my post helps someone who’s facing similar issues with their Power BI Dashboards…

Thank you for reading….

Cheers,

PMDY