Hi Folks,
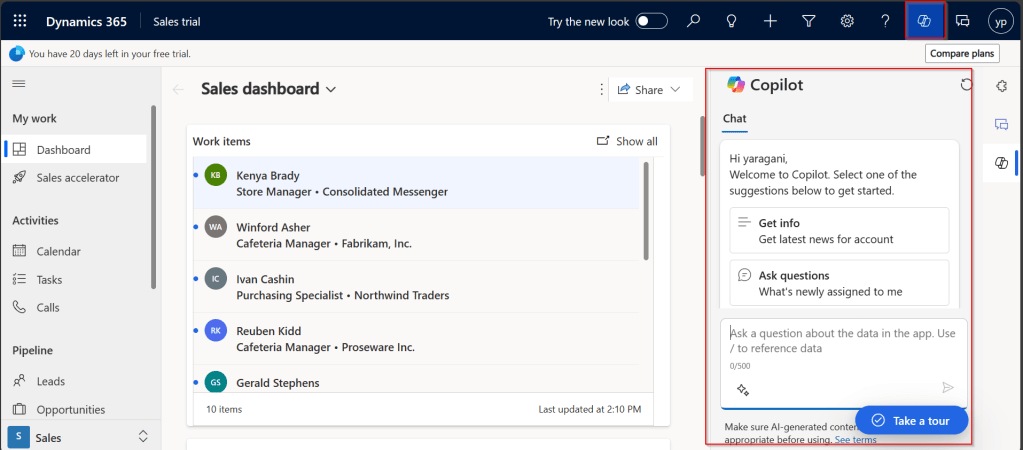
Have you noticed Visualize this view button in in the app bar of any grid view of Dynamics 365?
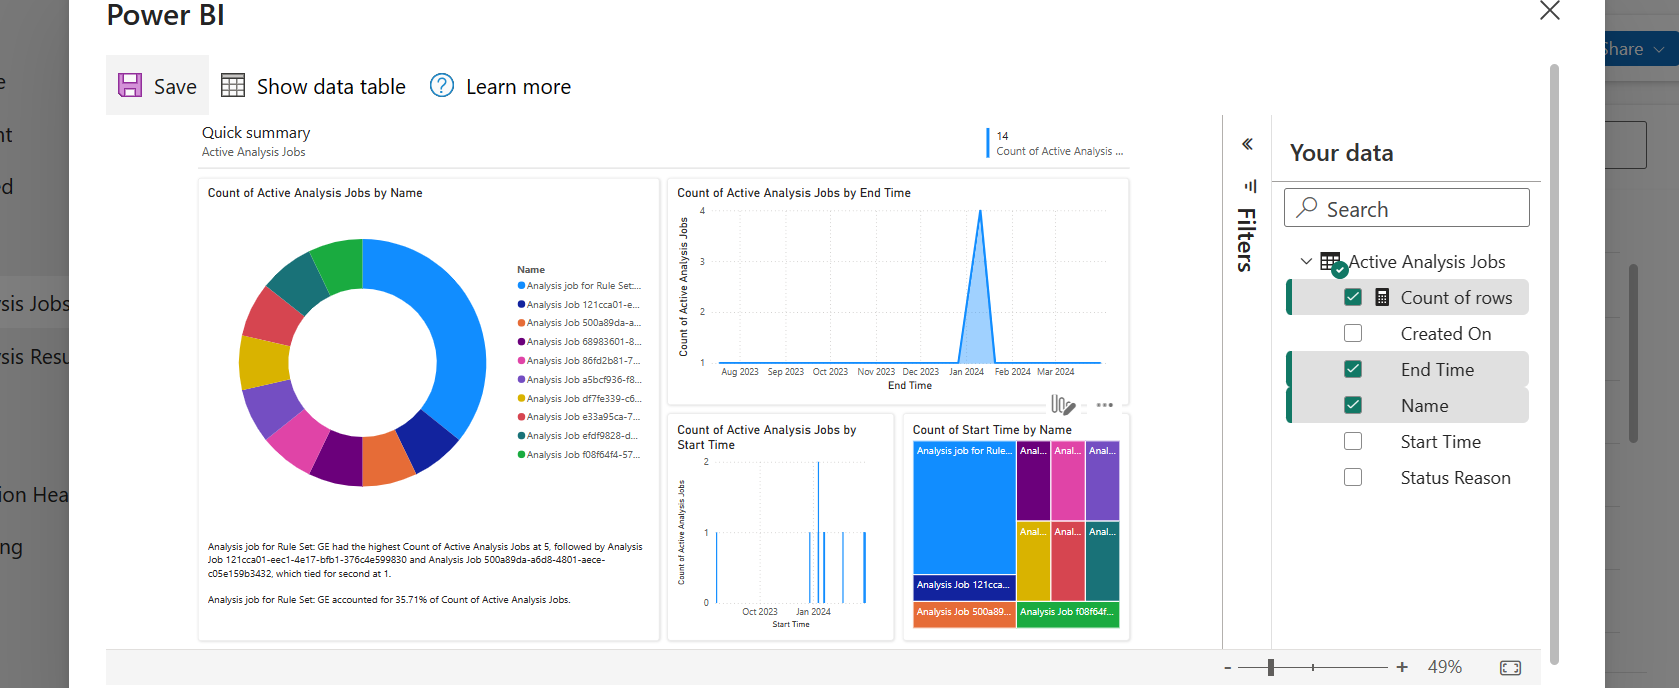
Here is a dashboard built within couple of minutes. While this can greatly help end users visualize the data present in the system. So, in this post, let’s understand bit more details about this capability and what are the some of the features which are left behind.
Let’s understand the how’s this is generated along with its capabilities and disadvantages compared to traditional Power BI dashboard both from Developer and end user perspective, please note that this is my understanding..
For Developers:
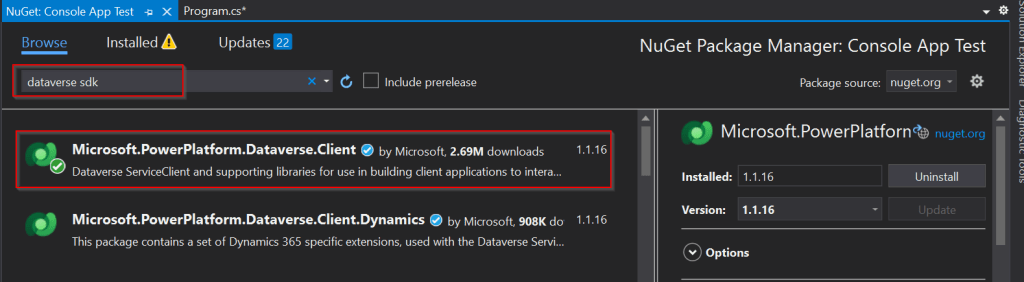
a. Visualize this view uses a PCF Control which calls the Power BI REST API and then generates the embed token for the report embedding that into an Iframe.
b. Then uses Power BI JavaScript API to handle user interactions with the embedded report such as filtering or highlighting data points.
c. When Power BI first generates your report, it takes a look through your data to identify patterns and distributions and pick a couple of fields to use as starting points for creating the initial set of visuals when data is not preselected.
d. Any changes to the data fields calls the UpdateView of the PCF Control and there by passing the updated data fields to REST API and then displays the visuals.
e. Visuals will be created with both selected and non-selected fields which are the related to the selected fields in the data pane.
For End Users & Developers:
Advantages:
- Visuals are generated when no data is selected
- Cross Highlighting is possible
- Click on the Report to see Personalize this visual option
- People with Contributor, Member, or Admin role assigned can save the Report to workspace
- Users with no access to Power BI cant view this feature, they can request for free Power BI License
- Free License users can save the Report to thier personal workspace
- Users get build permission when any role above Contributor is assigned and reshare permission is given
- The report will be saved as direct query with SSO enabled and honours dataverse settings
- Show data table presents a list of tables if the model comprises of multiple tables.
- Able to specify the aggregation for each of the field in the model.
Disadvantages:
- Only able to export summarized data from Visuals, you will be able to export the data in table from data table.
- Only Visual Level, no page level or report level filters
- During these reports creation, the model is configured to use Direct Query with Single Sign On.
- Embed a report on a Dataverse form requires modifying the XML of the solution
- Report published into the workspace are available to download but downloaded reports will not be able to customize further in Power BI Desktop as it would be built using Native Queries.
- If the page is kept ideal for long time or the user navigates to other browser window, the session and report will be lost.
Considerations & Limitations:
- Power BI Pro license is required to create these reports
- While this is wonderful for end users to visualize the data but this is not an alteranative to building reports using Power BI Desktop.
Hope this helps.
Cheers,
PMDY