While I was working with Power Automate, I encountered this error, FYI, I was using Old Designer UI, hope the fix I found was an easy one but could help someone else without digging deeper and troubleshooting by changing the flow. I tried refreshing the page couple of times as suggested in error message but still the issue remains.
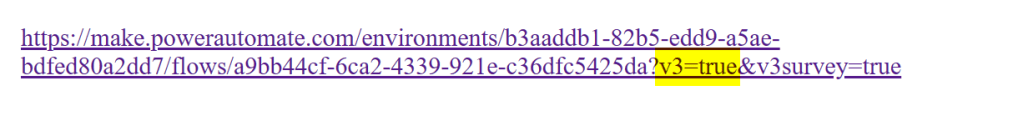
To solve this, just grab the Power Automate URL from your browser search bar…you should see something like below.
Just replace it to
While this could be an intermittent issue, but it persists for few mins or so. So, this tip can help someone.
When I was working with my Power BI reports, I suddenly started encountering this error. I don’t have any more clue except this error message which I could see in my Power BI Desktop as below. Initially I thought there could be some problem connecting to my SQL end point of my Dataverse connection, but it isn’t.
The error message above clearly say that the Queries are blocked. I then quickly started reviewing the model of the Power BI Report to see if there were any issues like the Relationships etc. But I couldn’t find anything in my relationships. Since I was using SQL Connection to my Dataverse, I tried to increase the Command timeout in minutes (max value being 120 minutes) from Advanced options of my connection but still the same error.
Cause: Then I quickly noticed that in my model I have fetched the same table data both using Direct Query and Import mode. So, when I was refreshing, because of the relationships, the one imported is being dependent on the one with Direct Query.
Fix: After review, the unnecessary Direct Query table was removed and voila it fixed the issue.
If anyone is facing the same problem, I strongly recommend you review the Semantic Model of your Power BI Report.
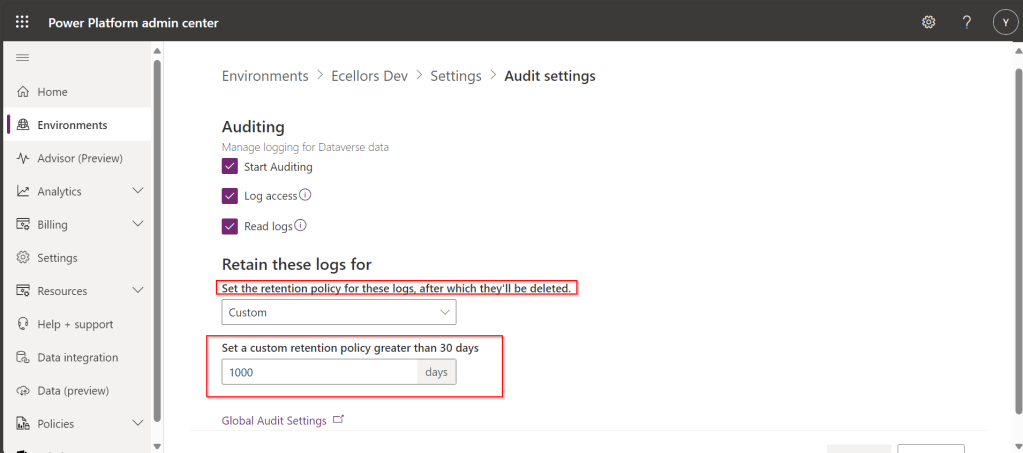
Do you know that you can set to auto delete the audit log information from Admin center. Yes, you can do this from Power Platform Admin center. Of course, this tip is a very small one, not knowing such feature can cost you so much time to figure out the Audit log deletion.
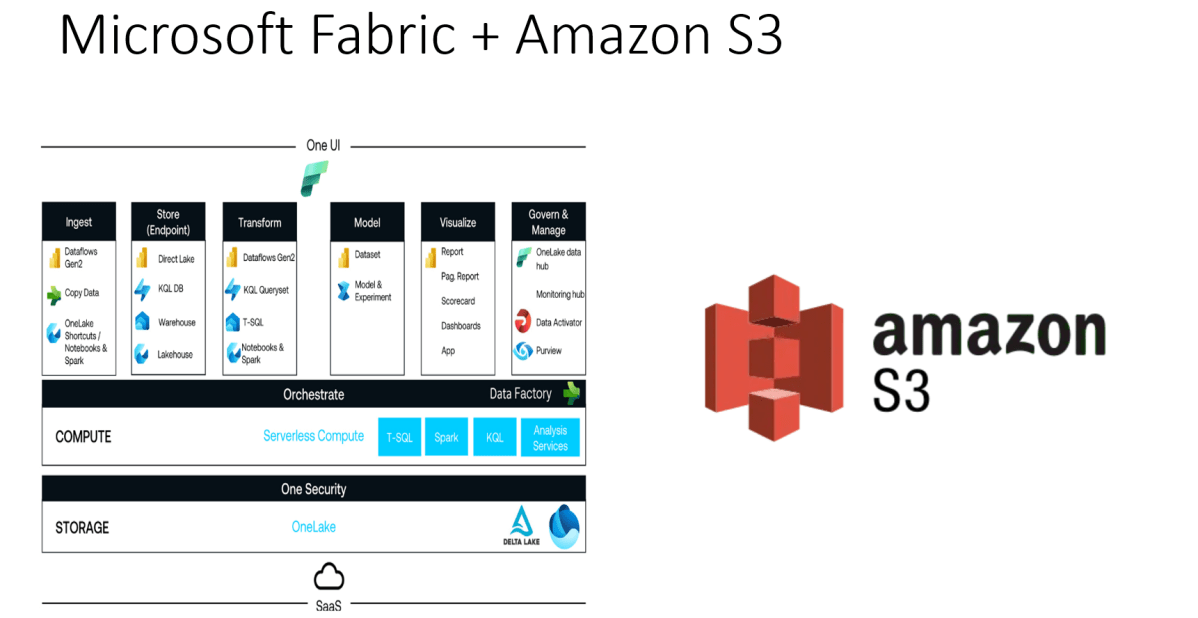
Did you ever try out the features released with Microsoft Fabric during Ignite 2023. So here is my first YouTube video on how you can use the features in Microsoft Fabric to show a Power BI report out of CSV File in AWS S3 bucket.
Earlier when you want to achieve such requirement, you would need to write Python script in Power BI Desktop to show anything from AWS S3 bucket in Power BI. Also, tons of new features included ex. One Lake Data Hub and also brought Data Engineering, Data Science, Data Warehouse, Real Time Analytics under one umbrella so it paved way for building great Data Projects especially Big Data.
So, I would definitely recommend you check out the features…all you need is just register for a free Fabric Trial, that’s it, you can use these 60 days. This is more than enough to try out. You can find the link on the Fabric page itself, however I am not sure if this is only for a limited period of time. Don’t waste this.
If you want to learn about these features, don’t forget to check the Microsoft Learn and complete the Fabric Challege here. I hope you would definitely love them.
GnuPG is a complete and free implementation of the OpenPGP standard. GnuPG allows you to encrypt and sign your data and communications; it features a versatile key management system, along with access modules for all kinds of public key directories. GPG can use both symmetric and asymmetric encryption to encrypt and decrypt.
So, now let’s talk about the tool Gpg4Win. Gpg4win is an email and file encryption package for most versions of Microsoft Windows and Microsoft Outlook, which utilizes the GnuPG framework for symmetric and public-key cryptography, such as data encryption, digital signatures, hash calculations etc. It’s open source and a free tool, it has been widely used by many of the encryption implementations. So, let’s see how you can install a GnuPG Software.
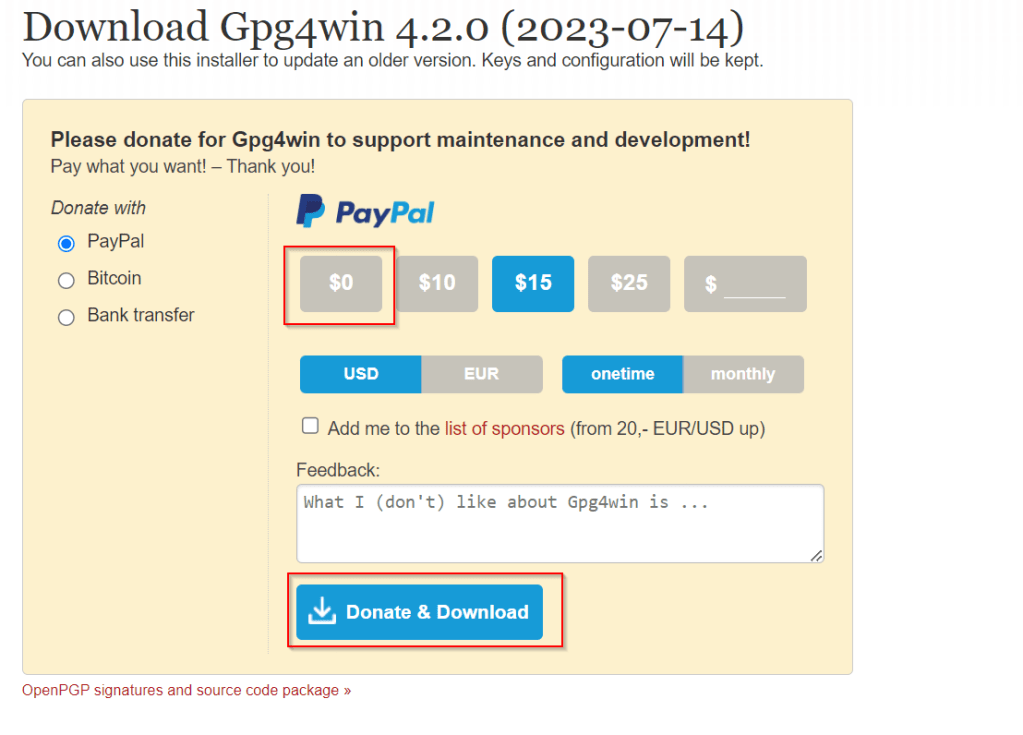
You can navigate to this GnuPG Download link of the official download page. You can download the latest version, as of writing this blog Gpg4Win 4.2.0 is the latest.
Gpg4win 4.2.0 contains mainly, rest of the components aren’t of interest for this blog:
1.GnuPG 2.4.3 : Actual software used to encrypt and decrypt.
2. Kleopatra 3.1.28: Kleopatra is a certificate manager and GUI for GnuPG, it stores all your certificates and keys.
Choose $0 and proceed to download which now
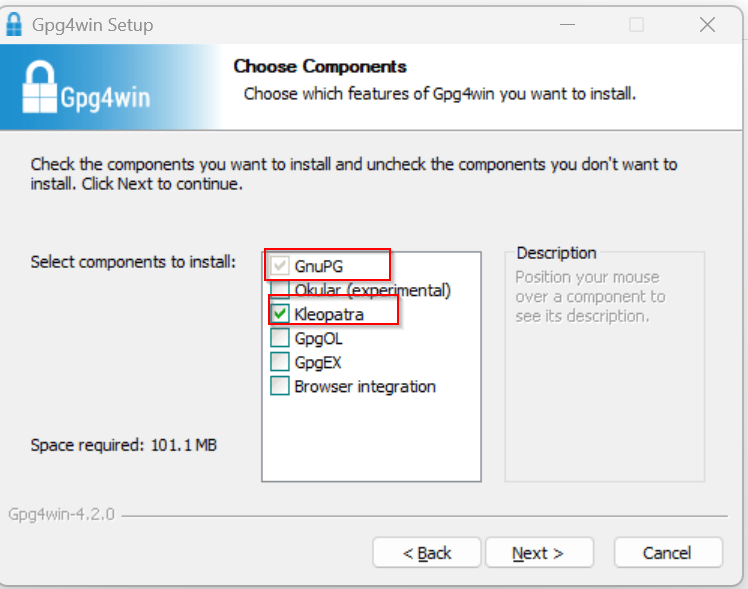
This now downloads the Gpg4Win software. So once click and start your installation, choose the necessary components required.
You can proceed to select only GnuPG, Kleopatra or both, which installs only GnuPG command line and/or Kleopatra which is a windows utility.
If you choose not to install Kleopatra, it’s ok, you still be able to encrypt and decrypt but only using command line, but if you have Kleopatra, you can use GUI for encryption or decryption.
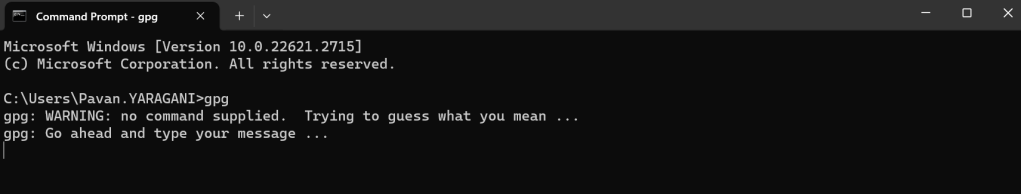
Once you have installed GnuPG, just open Command Prompt, start entering gpg..
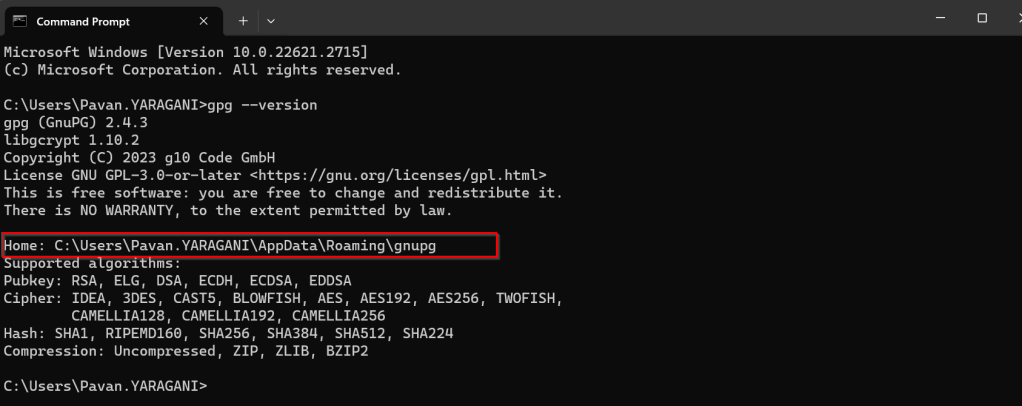
You can also check the root folder where all your Key rings will be stored…
With gpg is now set up in your PC, you will be able to encrypt and decrypt using gpg command line scripts.
Ok, now everything is good, how about if other persons when logged into this PC, will they be able to use the gpg commands to encrypt or decrypt, of course not, for this you need to follow as below…
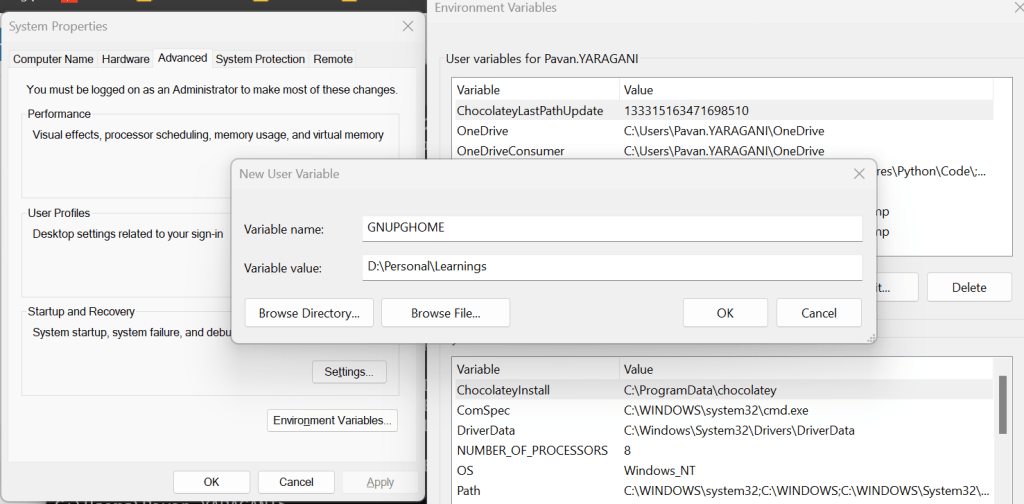
All you need to set an environment variable which is of scope user and set the home location for gpg to look for keys in that machine.
Once you have set this, the home location of gpg is now changed, so any user who have access to this path can be able to encrypt or decrypt without issues.
You check the modified location by using this command
I hope you have learned something…below this post, I have added the link to the blog post where the encryption and decryption just below this blog post, we will see how you can encrypt and decrypt files using gpg command line utility being called from C#. Any questions do let me know in comments….
Happy Integrating Power Platform with 3rd party Applications.