Restore deleted records in Dataverse table – Quick Review

Hi Folks,

Have you or your user ever mistakenly deleted records in Model Driven Apps..? Do you remember we can recover the deleted records from recycle bin in your PC, now similarly we can also do this in Dataverse also.

In this blog post, I will discuss about how you can retrieve a deleted record in Dataverse.

Till now, we have following tools in XRMToolBox wherein we can restore the deleted records (https://www.xrmtoolbox.com/plugins/DataRestorationTool, https://www.xrmtoolbox.com/plugins/NNH.XrmTools.RestoreDeletedRecords, https://www.xrmtoolbox.com/plugins/BDK.XrmToolBox.RecycleBin) but wait, these tools require Auditing to be enabled for the concerned table. What if you don’t have auditing enabled for that…now we have a preview feature which comes as a saviour where you don’t need any external tools anymore to restore them.

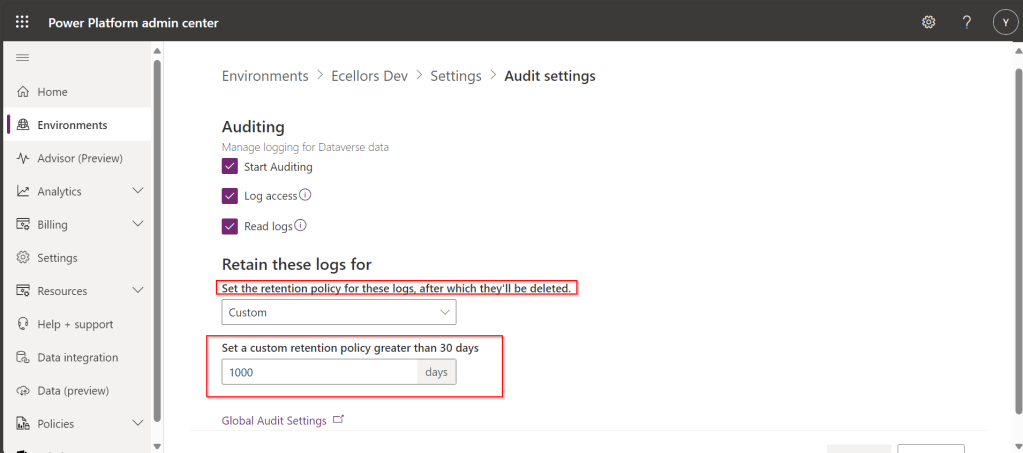
To use this, just enable this feature from Power Platform Admin Center, you can optionally set the recovery interval if you wish to.

For this, we take Contact table as example, now let’s check the audit setting of the contact table..well, it’s turned off.

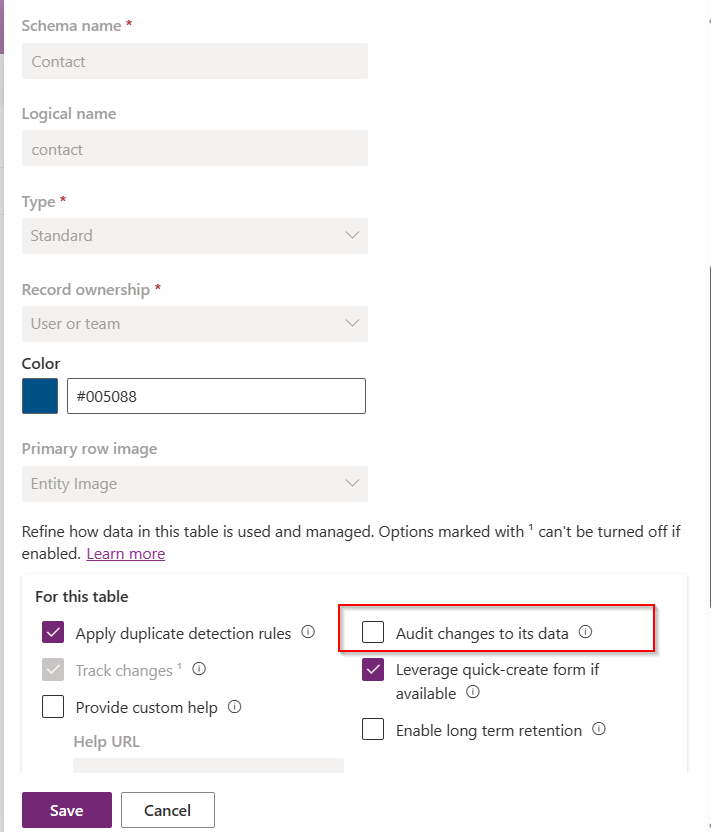
Even the auditing is not enabled for the contact entity, with this Recycle Bin Preview feature, we should be able to recover the records, let’s see this in action.

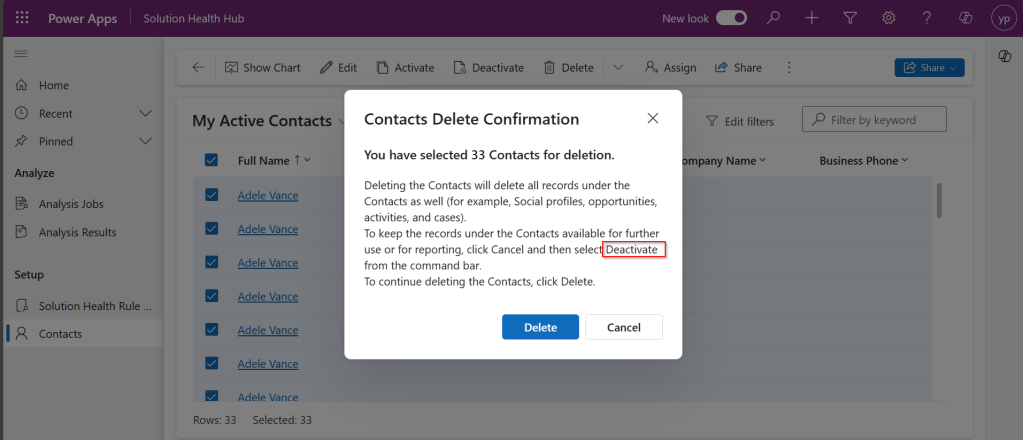
Now try deleting the contact records, I have 33 contact records in my environment, let me delete all of them.

It suggests you deactivate rather than delete, still let’s delete them.

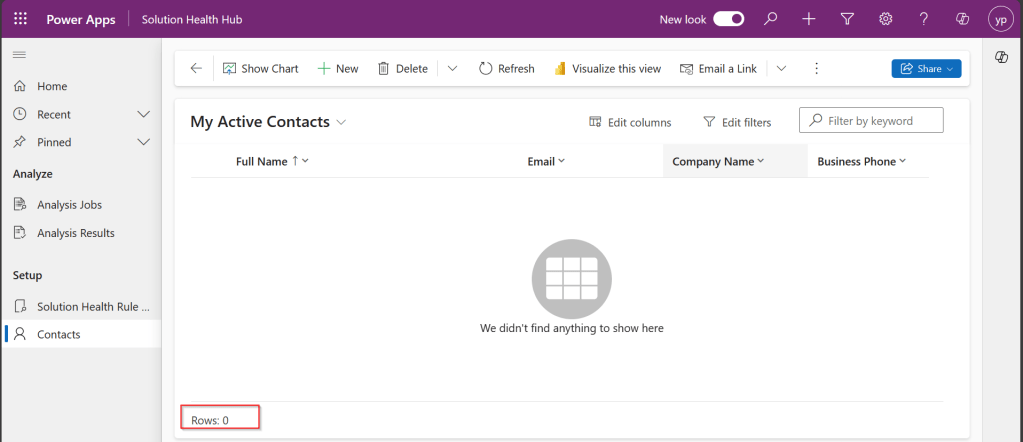
All the records are now deleted.

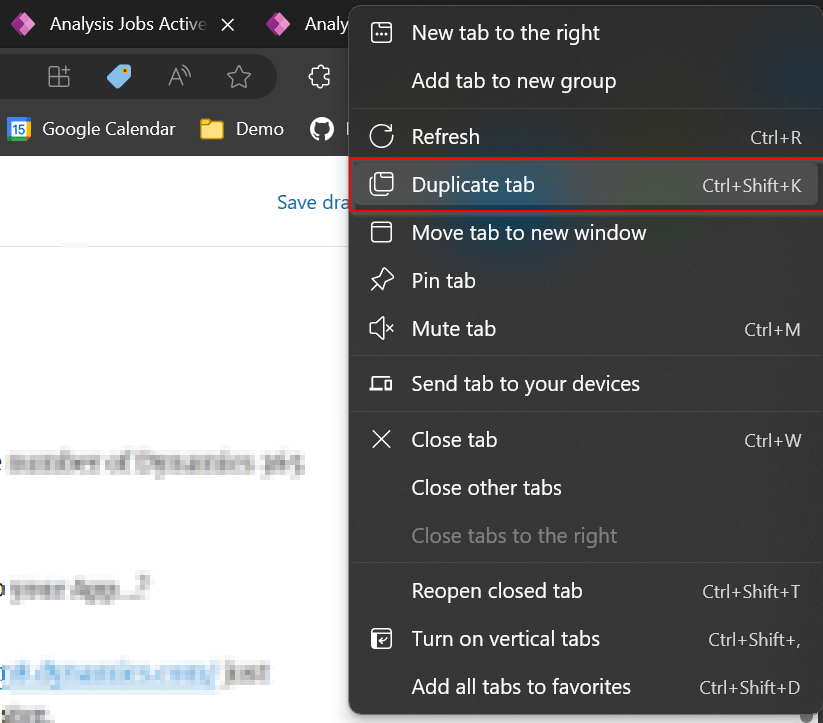
Now, let’s see how to recover them back…. just go to Power Platform Admin Center –> Environments –> Settings –> Data Management

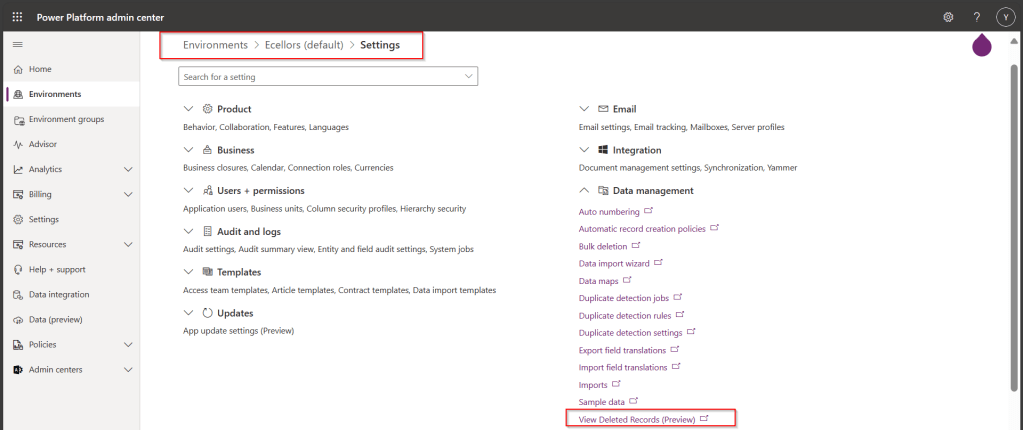
As you click on View Deleted Records, you will be navigated to a view from a new table called DeletedItemReference which stores the deleted records just like recycle bin.

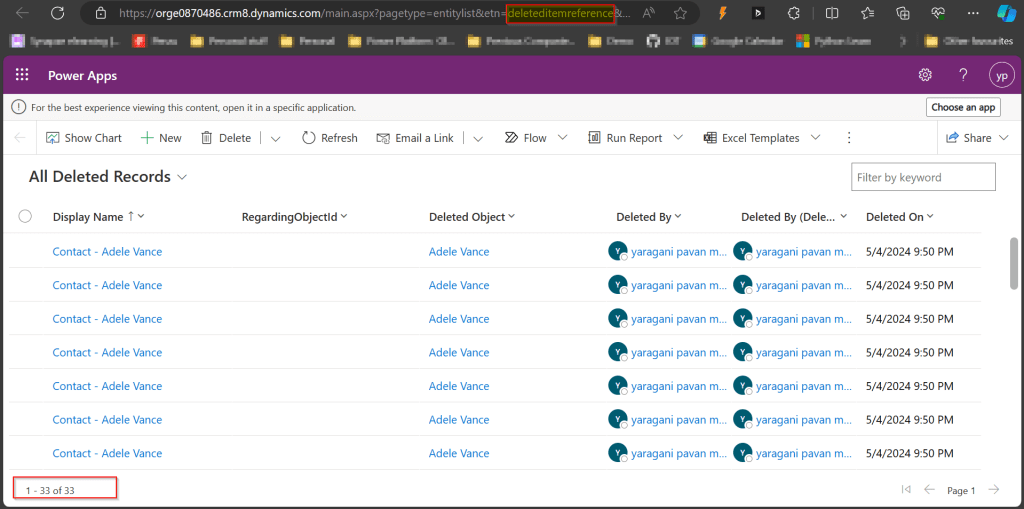
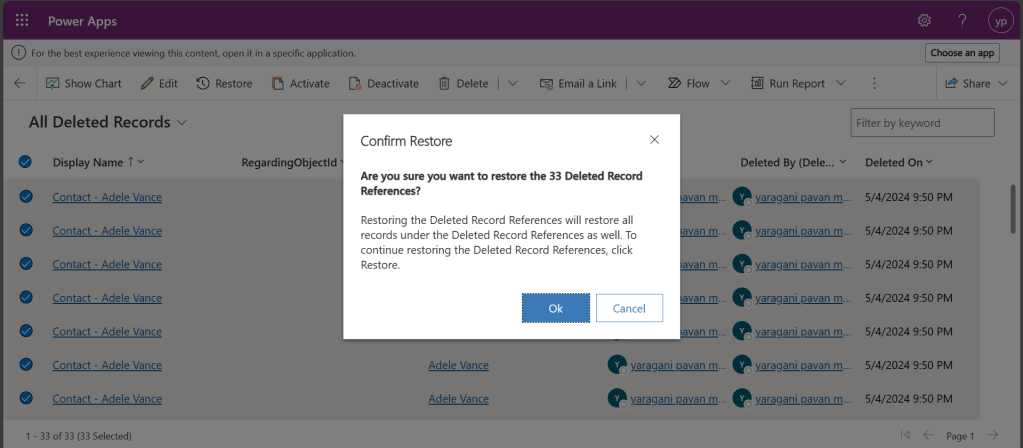
Just select the records, you should see a restore button available on the command bar, here I choose All Deleted Records.

Once you click on restore, you will be shown a confirmation dialog, click on Ok.

You should see the records back in the respective table i.e. Contact here.

In this post, we saw recovering records which were deleted manually…the same thing works for records deleted using Bulk Delete jobs or whatever way you try to delete.

Note:

  1. This is a preview feature and not recommended to use in Production environments right away.
  2. You will not be able to recover the deleted records when you have custom business logic applied to delete the records from deleteditemreference table also, moreover this still a preview feature and not recommended for Production use.
  3. You will be able to recover records which were deleted by the Cascading behavior, like record Child records alone when Parent is still deleted.
  4. You can only recover up to the time frame you have set above and maximum up to 30 days from date of deletion.

Hope you learned something new…that’s it for today…

Reference:

https://learn.microsoft.com/en-us/power-platform/admin/restore-deleted-table-records

Cheers,

PMDY

Using Bulk Operations messages – #01 (Plugins)

Well, this could be a very interesting post as we talk about optimizing the Dataverse performance using bulk operation messages and too using Dataverse plugin customizations but wait, this post is not complete because of an issue which I will talk later in the blog. First let’s dig into this feature by actually trying out. Generally, every business wants improved performance for any logic tagged out to out of box messages and so developers try to optimize their code in various ways when using Dataverse messages.

Firstly, before diving deeper into this article, let’s first understand the differences between Standard and Elastic tables, if you want to know a bit of introduction to elastic tables which were newly introduced last year, you can refer to my previous post on elastic tables here.

The type of table you choose to store your data has the greatest impact on how much throughput you can expect with bulk operations. You can choose out of two types of tables in Dataverse, below are some key differences you can refer to: 

 Standard TablesElastic Tables
Data StructureDefined SchemaFlexible Schema
Stores data in Azure SQLStores data in Azure Cosmos DB
Data IntegrityEnsuredLess Strict
Relationship modelSupportedLimited
PerformancePredictableVariable, preferred for unpredictable and spiky workloads
AgilityLimitedHigh
PersonalizationLimitedExtensive
Standard and Elastic Table Differences

Plugins:

With Bulk Operation messages, the APIs being introduced are Create MultipleUpdateMultiple,DeleteMultiple (only for Elastic tables), Upsert Request(preview). As of now you’re not required to migrate your plug-ins to use CreateMultiple and Update Multiple instead of Create and Update messages. Your logic for Create and Update continues to be applied when applications use CreateMultiple or UpdateMultiple

This is mainly done to prevent two separate business logics for short running and long duration activities. So, it means Microsoft have merged the message processing pipelines for these messages (Create, Create Multiple; Update, Update Multiple) that means Create, Update messages continue to trigger for your existing implemented scenarios, when you update to use Create Multiple, Update Multiple still the Create, Update will behave.

Few points for consideration:

  1. While I have tested and still could see IPluginExecutionContext only provides the information and still I have noted Microsoft Documentation suggests using IPluginExecutionContext4 for Bulk Messages in Plugins where it is being shown as null yet.
  2. While you were working with Create, Update, Delete, you could have used Target property to get the input parameters collection, while working with Bulk Operation messages, you need to use Targets instead of Target.
  3. Instead of checking whether the target is Entity you need to use Entity Collection, we need to loop through and perform our desired business logic
  4. Coming to Images in plugin, these will be retrieved only when you have used IPluginExecutionContext4.

Below is the image from Plugin Registration Tool to refer(e.g. I have taken UpdateMultiple as reference, you can utilize any of the bulk operation messages)

Sample:

Below is the sample, how your Bulk operation message plugin can look like…you don’t need to use all the contexts, I have used to just check that out.

using System;
using System.Collections.Generic;
using System.Linq;
using System.Text;
using System.Threading.Tasks;
using Microsoft.Crm.Sdk;
using Microsoft.Xrm.Sdk;
using Microsoft.Xrm.Sdk.Query;
namespace Plugin_Sample
{
public class BulkMessagePlugin : IPlugin
{
public void Execute(IServiceProvider serviceProvider)
{
IPluginExecutionContext context = (IPluginExecutionContext)serviceProvider.GetService(typeof(IPluginExecutionContext));
IPluginExecutionContext2 context2 = (IPluginExecutionContext2)serviceProvider.GetService(typeof(IPluginExecutionContext2));
IPluginExecutionContext3 context3 = (IPluginExecutionContext4)serviceProvider.GetService(typeof(IPluginExecutionContext3));
IPluginExecutionContext4 context4 = (IPluginExecutionContext4)serviceProvider.GetService(typeof(IPluginExecutionContext4));
ITracingService trace = (ITracingService)serviceProvider.GetService(typeof(ITracingService));
// Verify input parameters
if (context4.InputParameters.Contains("Targets") && context.InputParameters["Targets"] is EntityCollection entityCollection)
{
// Verify expected entity images from step registration
if (context4.PreEntityImagesCollection.Length == entityCollection.Entities.Count)
{
int count = 0;
foreach (Entity entity in entityCollection.Entities)
{
EntityImageCollection entityImages = context4.PreEntityImagesCollection[count];
// Verify expected entity image from step registration
if (entityImages.TryGetValue("preimage", out Entity preImage))
{
bool entityContainsSampleName = entity.Contains("fieldname");
bool entityImageContainsSampleName = preImage.Contains("fieldname");
if (entityContainsSampleName && entityImageContainsSampleName)
{
// Verify that the entity 'sample_name' values are different
if (entity["fieldname"] != preImage["fieldname"])
{
string newName = (string)entity["fieldname"];
string oldName = (string)preImage["fieldname"];
string message = $"\\r\\n – 'sample_name' changed from '{oldName}' to '{newName}'.";
// If the 'sample_description' is included in the update, do not overwrite it, just append to it.
if (entity.Contains("sample_description"))
{
entity["sample_description"] = entity["sample_description"] += message;
}
else // The sample description is not included in the update, overwrite with current value + addition.
{
entity["sample_description"] = preImage["sample_description"] += message;
}
}
}
}
}
}
}
}
}
}

I have posted this question to Microsoft regarding the same to know more details on this why the IPluginExecutionContext4 is null , while still I am not sure if this is not deployed to my region, my environment is in India.

Recommendations for Plugins:

  • Don’t try to introduce CreateMultiple, UpdateMultiple, UpsertMultiple in a separate step as it would trigger the logic to be fired twice one for Create operation and another for CreateMultiple.
  • Don’t use batch request types such as ExecuteMultipleRequest, ExecuteTransactionRequest, CreateMultipleRequest, UpdateMultipleRequest, UpsertMultipleRequest in Plugins as user experiences are degraded and timeout errors can occur.
  • Instead use Bulk operation messages like CreateMultipleRequestUpdateMultipleRequest, UpsertMultipleRequest
    • No need to use ExecuteTransactionRequest in Synchronous Plugins as already they will be executed in the transaction.

    Hope this guidance will help someone trying to customize their Power Platform solutions using Plugins.

    I will write another blog post on using Bulk operation messages for Client Applications…

    Cheers,

    PMDY

    Delete audit log information from Power Platform Admin Center effortlessly

    Hi Folks,

    Do you know that you can set to auto delete the audit log information from Admin center. Yes, you can do this from Power Platform Admin center. Of course, this tip is a very small one, not knowing such feature can cost you so much time to figure out the Audit log deletion.

    Open Power Platform Admin Center https://admin.powerplatform.microsoft.com/

    Select an environment –> Navigate to Settings –> Audit Settings

    As highlighted below, you can specify the custom number of days within which your Audit logs can be deleted.

    Then click on save available at the bottom of the screen.

    Hope someone would find this useful…

    Cheers,

    PMDY

    Open Dynamics 365 Model Driven Apps faster with these two tips…Quick Tip

    Hi Folks,

    With increase in the adoption of Power Platform, the number of Dynamics 365 Model Driven apps are growly rapidly.

    Did you ever face any performance issues opening up your App…? These tips if remembered can definitely help you down the road in your implementations.

    Tip 1: Want to load your App faster…are you trying to open a URL like this https://ecellorsdev.crm8.dynamics.com/ , then just append main.aspx, this makes your App to load faster.

    Tip 2: Are you trying to open the settings page similar to this URL https://ecellorsdev.crm8.dynamics.com/main.aspx?settingsonly=true and it keeps on loading…

    Then right click on your browser and choose to duplicate your tab.

    Both these techniques, helps your App to resolve quickly…don’t forget to try out and see while working on your projects.

    Cheers,

    PMDY

    3 ways for error handling in Power Automate

    While everything is being automated, we will learn how effective you can handle the errors while you automate the process. Ideally when a failure happens in a Power Automate cloud flow, the default behavior is to stop processing. You might want to handle errors and roll back earlier steps in case of failure. Here are 3 basic first hand rules to consider implementing without second thought.

    Run after

    The way that errors are handled is by changing the run after settings in the steps in the flow, as shown in the following image.

    Screenshot showing the run after settings.

    Parallel branches

    When using the run after settings, you can have different actions for success and failure by using parallel branches.

    Screenshot showing the parallel branch with run after.

    Changesets

    If your flow needs to perform a series of actions on Dataverse data, and you must ensure that all steps work or none of them work, then you should use a changeset.

    Screenshot that shows a changeset in flow.

    If you define a changeset, the operations will run in a single transaction. If any of the step’s error, the changes that were made by the prior steps will be rolled back.

    Special mentions:

    1. Using Scopes – Try, Catch, Finally
    2. Retry policies – Specify how a request should be handled incase failed.
    3. Verify the Power Automate Audit Logs from Microsoft Purview Compliance Portal
    4. Last but not the least – Check the API Limits for the different actions.

    Cheers,

    PMDY

    Unable to persist the profile – Quick Tip

    Hi Folks,

    Are you debugging the Dynamics 365 Plugins using Plugin Profiler, did you ever notice this problem that you were unable to persist profile so as to debug your plugin. Did you got frustrated as you couldn’t capture the profile even after lot of tries installing and uninstalling the profiler. Just read on. I am writing this blog post after fixing a similar situation with one of my Plugin.

    First of all, I would advise you to check the below.

    1. Plugin trace log under Settings –> Plugin Trace Log.
    2. Check if your Plugin is being called multiple number of times
    3. Check the filtering attributes of your Plugin whether it is causing to go in an infinite loop
    4. Suppose if you have added an image, did you select the respective attributes of the image
    5. Did you add sufficient depth conditions to prevent infinite loop executions.
    6. At what step is your plugin running, is it in PreOperation, PostOperation.? In case you were throwing an error, change it to Prevalidation step and check.
    7. Were you using persist to entity option while debugging, try changing to throw an error and see.
    8. If you note that the system becomes unresponsive and you were not able to download the log file, then definitely your logic is getting called multiple times. Please reverify.

    Once you have verified these, you should be able to find out the exact root cause of the issue…I will leave to yourself.

    Thank you…and enjoy debugging…Power Platform Solutions…

    Cheers,

    PMDY

    Improve your SSIS Data Flow Task Performance by just setting a flag – Quick Tip

    Hi Folks,

    Thank you for visiting my blog today, this post is all about improving the performance of SSIS Data Flow Task which I would like to share with everyone.

    Do you know, you can improve your SSIS Data Flow Task easily just by setting AutoAdjustBufferSize Property of your data flow task. If you already know this, you can skip further reading.

    I already placed Balanced Data Distributors in my SSIS job, but the performance of Kingswaysoft CDS/CRM Component is not promising and too low.

    Thank you MalliKarjun Chadalavada for pointing me this.

    All you need to do is right click on your Data Flow Task..set AutoAdjustBufferSize to True and voila…there you go…

    Just test your SSIS job and notice the performance had been improved.

    Cheers,

    PMDY

    Debug Plugins with Dataverse Browser – Quick Recap

    Hi Folks,

    This post is for all who are working on D365 Model Driven Apps and mainly Plugins.

    Yes, you saw it right, in this blog post, we will see how can debug plugin without using our favorite plugin profiler which is very widely used from quite some time by everyone working on Plugins for Dynamics 365. All this is done by a tool called Dataverse Browser, which is not yet on XrmToolBox. Please note that there were some limitations as detailed in limitation section below.

    Here are 3 simple steps to follow..

    1. Install Dataverse Browser
    2. Attach the Debugger
    3. Run your actual operation.
    4. Step into your code and debug it.

    The tool embeds a web browser based on Chromium. It works by translating the Web API requests to SDK requests. Then it analyzes if plugin steps are registered on the message and it loads them, make them run locally. All other requests are sent to the Dataverse, so that the plugins are interacting with the real database.

    Download the latest source code of Dataverse browser here.

    Next extract the zip file downloaded as highlighted below

    Extract the zip file downloaded, open Dataverse.Browser Application as highlighted below.

    In the popup window, click on More info as highlighted below…

    Then run the application anyway…you will be presented with a window where you can select the environment. Going forward, any time you want to open Dataverse browser, just open the Dataverse.Browser.exe and choose the environment as below.

    Click on New, enter the details as above and key in the details.

    • Enter the settings of your environment:
      • A name meaningful for you
      • The host name of your instance (without the https://)
      • The path to the plugins assembly file (the dll). For a better experience, it should be compiled in debug mode with the pdb file generated.

    Then click Go.

    You just need to Authenticate to your instance.

    Once Authenticated to the respective model driven apps, all the Web API requests sent to Dataverse will be shown as below.

    I have following Plugin Libraries registered.

    Next step is to choose the instance and perform the respective operation which triggers the Plugin. So, in here, I will perform an update to the Account entity from the Dataverse Browser which triggers the Plugin.

    Once an update is performed, a Web API request gets recorded in the Dataverse browser as highlighted below.

    Since the Plugin is in Post Operation, i.e. Stage number is 40

    Just expand the Patch Request, you should see two operations on 30, 40, but area of interest here is for the Plugin which was registered on stage 40.

    Make sure you open the Visual Studio and perform the below steps from Dataverse Browser.

    Attach the debugger from Dataverse Browser by clicking on the Plug Symbol as below which will show the list of debugger options available for you to select from. Here I have selected Execute Plugins, plugin will be invoked. You can either select any of the three options as presented below.

    1.Do not execute plugins – recommended when you want to debug without actually triggering your plugin logic. i.e. With this approach even you can check the code in Production environment.

    2. Execute plugins/Execute plugins with auto break – recommended when you want to debug by triggering your actual plugin, this is recommended in case your plugin code had changed recently and in Development environments.

    Just select Ecellors Demo – Microsoft Visual Studio: Visual Studio Professional 2022 version which will launch an existing Visual studio 2022 as below in break mode. Next click on Continue as highlighted below or press Click F5 on your keyboard.

    This shows you that the debugger has been attached when you navigate to Dataverse Browser asking you to place your breakpoints.

    Now just place breakpoints in your code in Visual Studio. Just go back to Dataverse Browser and click on Ok on the Diaglog box.

    Perform the operation which triggers the Plugin from Dataverse Browser itself, this will hit the break point in Visual Studio from where you can debug your plugin.

    As you might have observed, your code need not throw exception in order to debug, you could do similarly to the way you would debug using Profiler. But here just that you don’t need to deploy the latest code to the Dataverse just for debugging purpose.

    This gives a lot more flexibility eases the way you debug plugins.

    Limitions:

    • There is no support for transactions.
    • When plugins are triggered because of a server-side operation, they will not be run locally.
    • For many reasons, behavior will never be perfectly similar to the one when plugins are executed on server side.

    Happy debugging, I hope you found this post useful…

    References:

    Dataverse Dev Browser

    Cheers,

    PMDY

    Connecting to your Dataverse instance to run SQL Queries without using XrmToolBox

    Hi Folks,

    Do you know that you can connect to your Dataverse DB right from your old toolbox SSMS, an express version would be more than enough to try out. Possibly we didn’t think of, but yes, we can…so let’s see that in this blog post.

    Open SSMS..

    1.Select Server type as Database Engine

    2. Server name as the environment URL from your Power Platform Admin Center as below.

    3. So key in those details as below, make sure to Select Authentication method as Azure Active Directory – Universal with MFA option.

    Once you click on Connect, you will be prompted for authentication via browser.

    Once your Sign-In is successful, you will be able to see.

    That’s it, how simple it was connecting to your Dataverse instances…

    Having said that it’s easy to connect to Dataverse, not all operations performed using normal transact SQL are supported here using Dataverse SQL. You could see it says Read-Only besides the instance name, that means that you don’t have any capabilities to modify from SQL.

    Because Dataverse SQL is a subset of Transact-SQL. If you want to see what statements are supported and what not, just go ahead to this link to find out.

    This opens a whole lot of opportunities to explore, so don’t forget to check this out.

    References:

    Dataverse SQL and Transact SQL

    Cheers,

    PMDY

    Install Dataverse Accelerator App from AppSource

    Subscribe to continue reading

    Subscribe to get access to the rest of this post and other subscriber-only content.