Use environment variable to deploy different version of Power BI Reports across environments in Power Platform

Hi Folks,

Thank you for visiting my blog…in this post, we will see how we can create and manage a Power BI Environment variable in Model driven apps in Power Platform.

So, let’s say, we have two environments 1. Dev 2. Default, we want to deploy export the solution with Power BI report from Dev environment as managed solution and import that to Default environment. The report in Default environment should point to Production workspace in Power BI.

I have the following reports in workspaces.

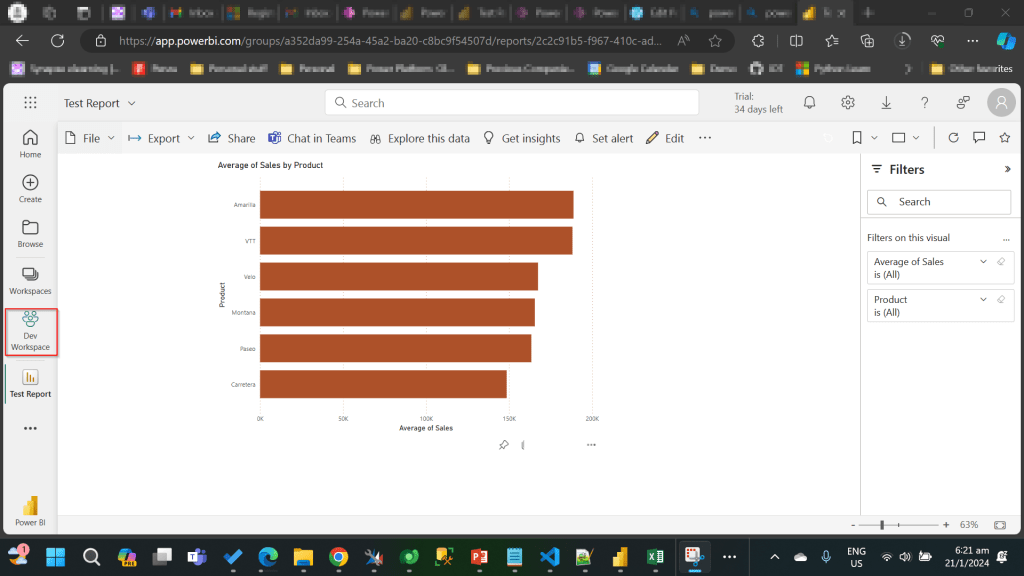
Development workspace:

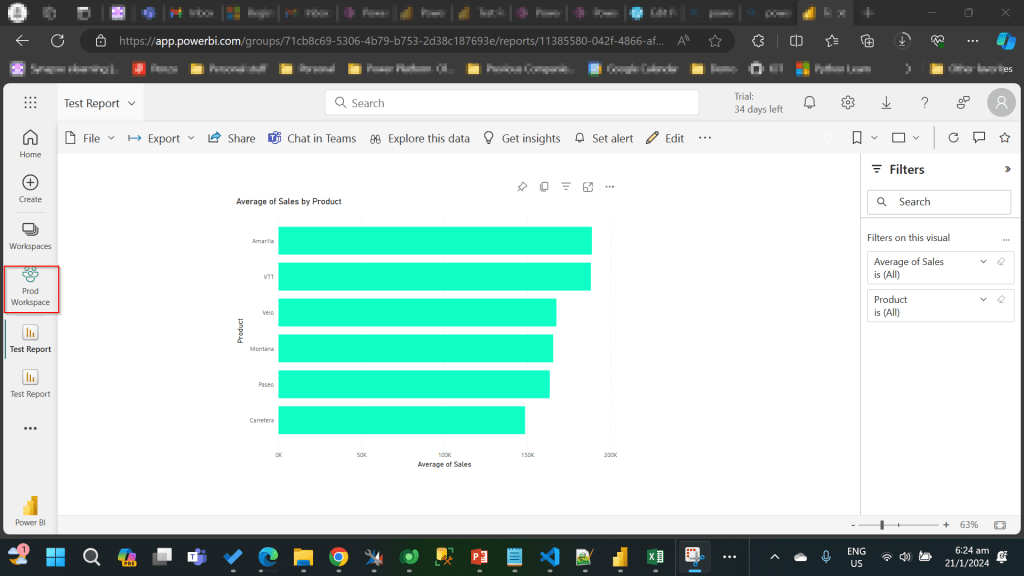
Production Workspace:

Now in order to deploy the report to Production, we need to use a managed solution and the report should point to Production workspace. So, in order to handle this, we will need to define an environment variable to store the workspace information. So, let’s get started.

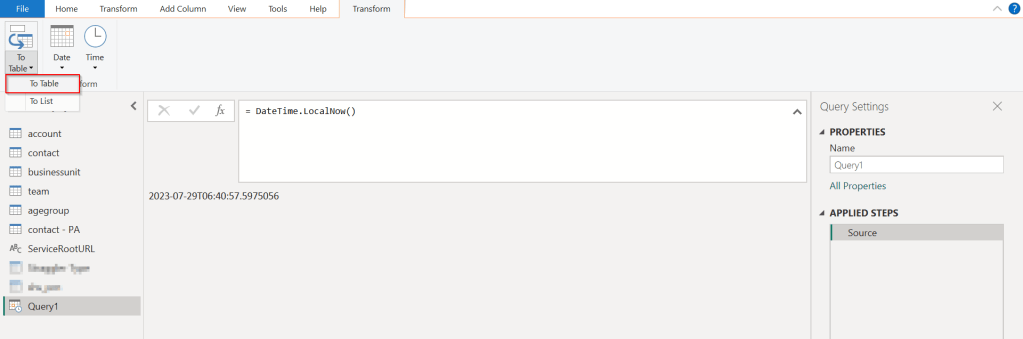
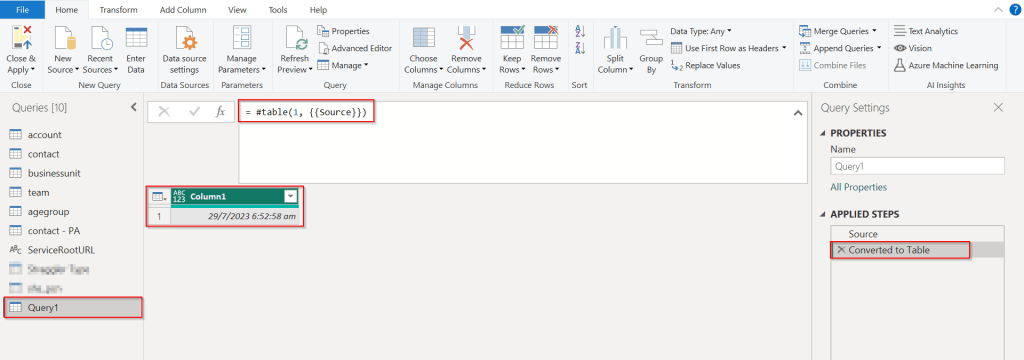
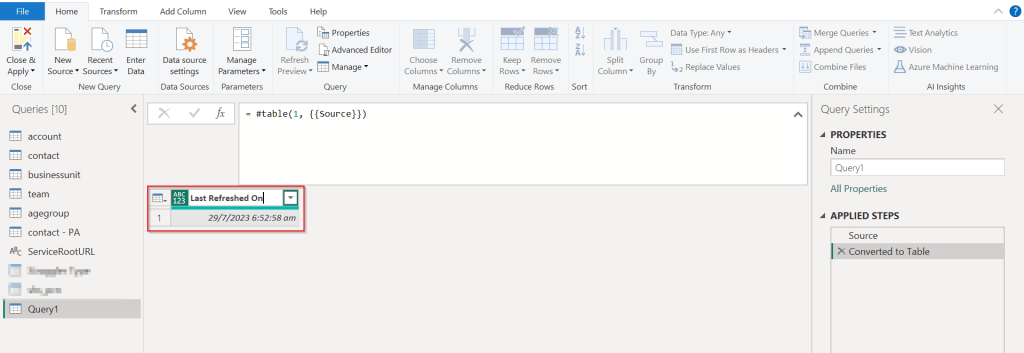
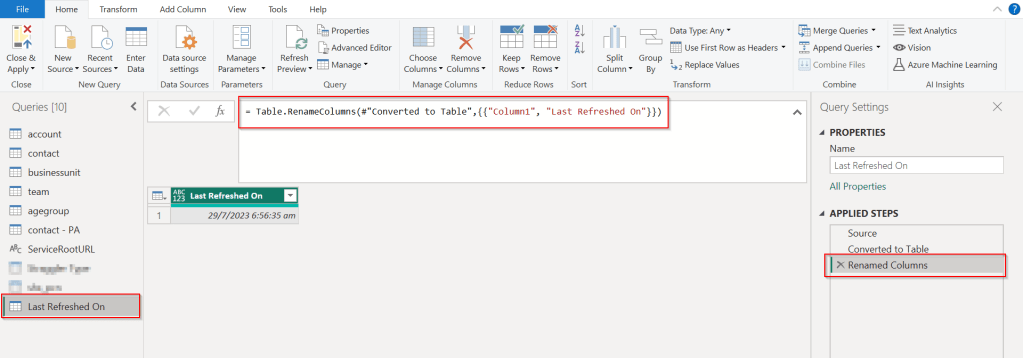
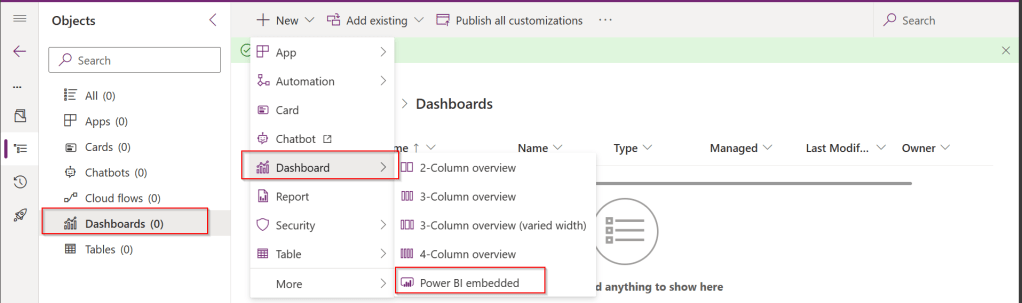
First, we will create a Power BI embedded report in Development environment.

While you were creating a Power BI embedded report, you will be presented an option to choose from the Power BI workspace.

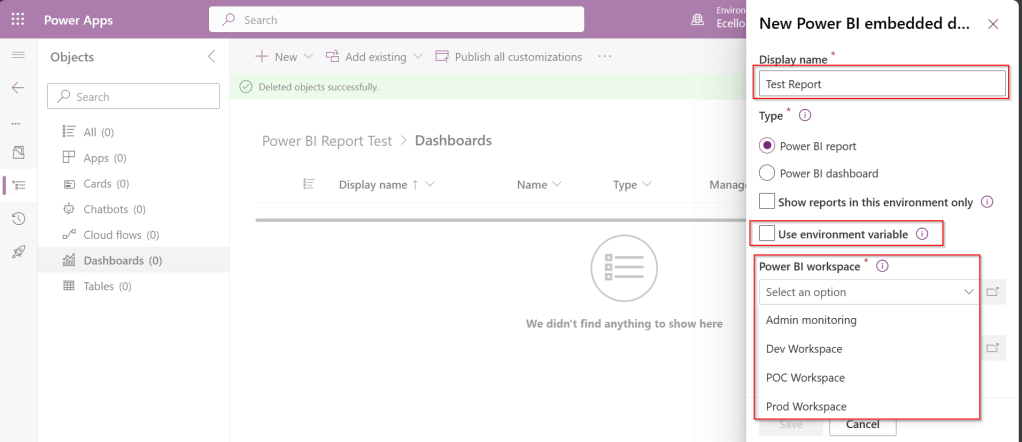
In order to achieve this requirement of deploying different versions of Power BI report in different instances, we need to use environment variable, so check the Use environment variable option.

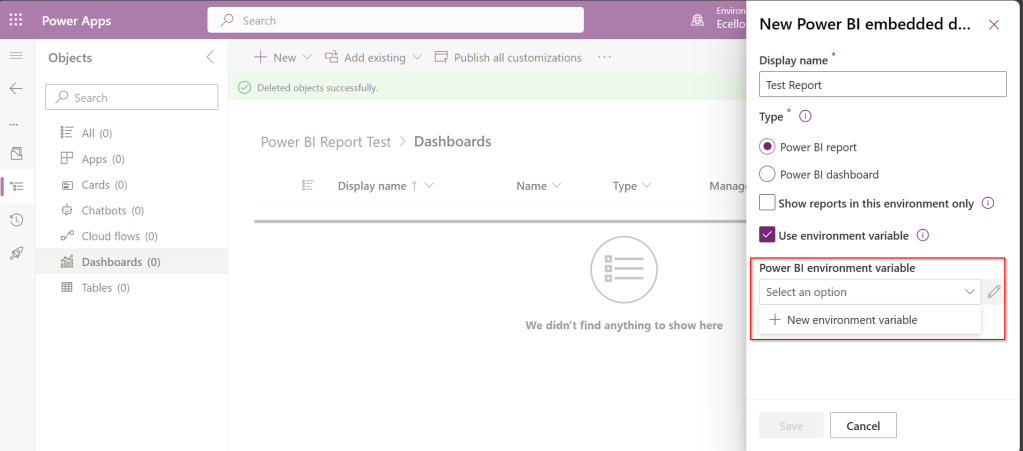
  1. The environment variable will be specific to this report and should be included in the solution when we want to deploy this report to higher environment.
  2. The next thing to note is that Default workspace would reflect the default value for this report and current value is required when we want to set to another report in a different environment.

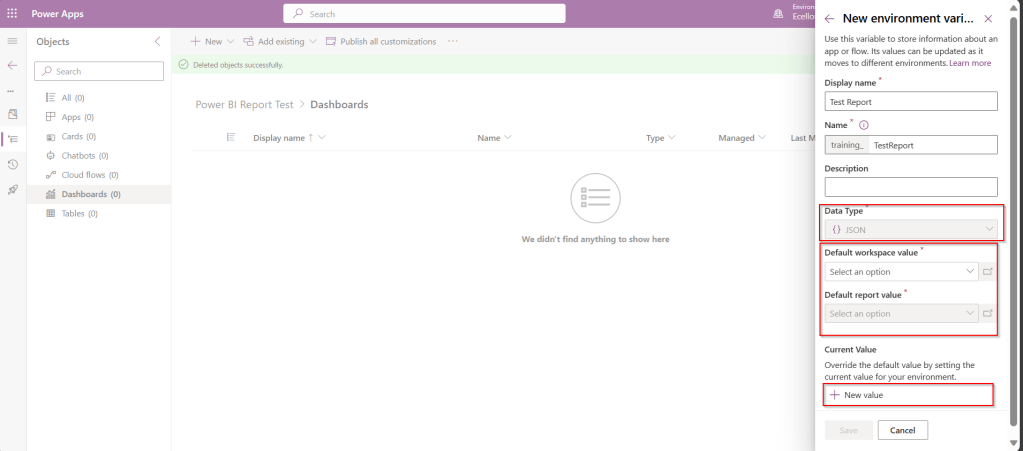
In Development environment, we choose as below..

Once the environment variable is saved, we now have 1 Dashboard and 1 environment variable component in the solution.

This solution is published and then exported as Managed solution, imported to another environment (Default environment which serves as Production environment here).

While importing, it asks to update environment variable, you can proceed to click on Import.

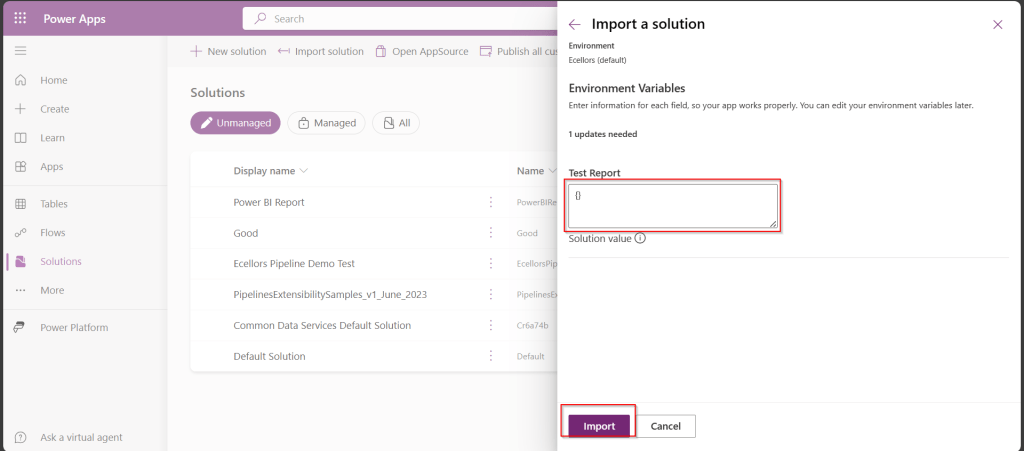
Now we have the solution in Default environment.

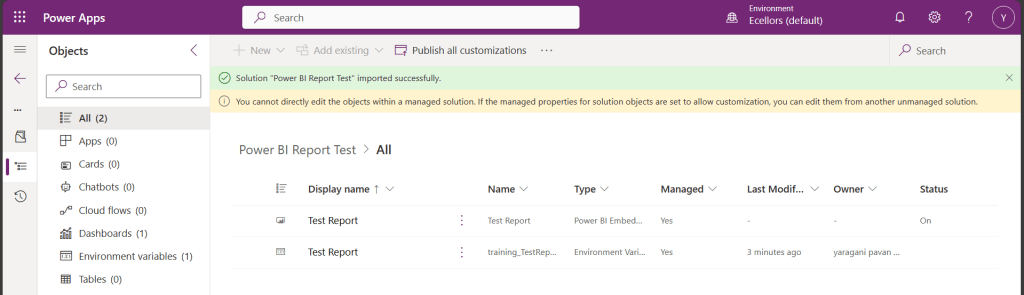
In order to update the value of the report to consider from Production environment, we need to open the report and click on the Pencil icon besides the Power BI Environment variable.

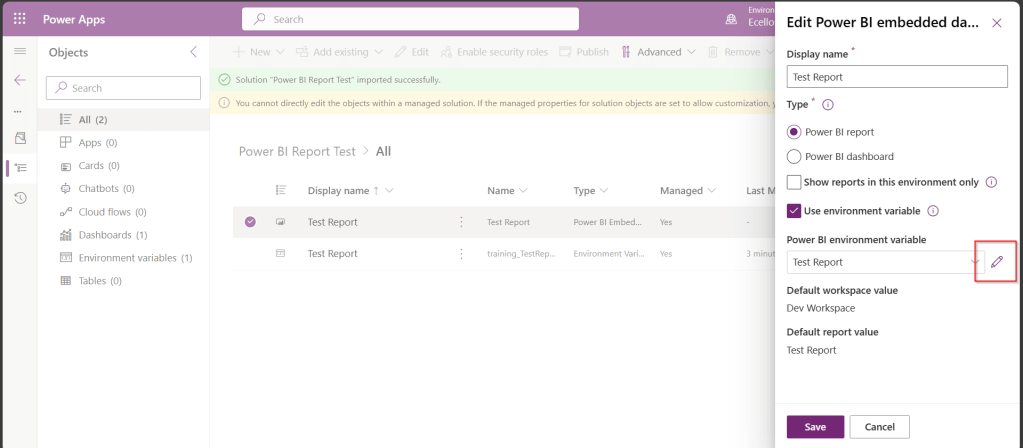
Then choose Prod workspace and its respective report and click save, publish.

That’s it…

You will be able to see two different reports in your Development and Default instances.

In this way, it is very easy to manage and deploy different versions of Power BI Report to different environments like Dev, Test, Prod.

Hope this helps…

Cheers,

PMDY

Creating a Power BI report from AWS S3 bucket in Microsoft Fabric – No code way

Hi Folks,

Did you ever try out the features released with Microsoft Fabric during Ignite 2023. So here is my first YouTube video on how you can use the features in Microsoft Fabric to show a Power BI report out of CSV File in AWS S3 bucket.

Earlier when you want to achieve such requirement, you would need to write Python script in Power BI Desktop to show anything from AWS S3 bucket in Power BI. Also, tons of new features included ex. One Lake Data Hub and also brought Data Engineering, Data Science, Data Warehouse, Real Time Analytics under one umbrella so it paved way for building great Data Projects especially Big Data.

So, I would definitely recommend you check out the features…all you need is just register for a free Fabric Trial, that’s it, you can use these 60 days. This is more than enough to try out. You can find the link on the Fabric page itself, however I am not sure if this is only for a limited period of time. Don’t waste this.

If you want to learn about these features, don’t forget to check the Microsoft Learn and complete the Fabric Challege here. I hope you would definitely love them.

Thank you.

Cheers,

PMDY

Installing GnuPG – Your open-source software companion to encrypt/decrypt files for your Power Platform Integrations

What’s GnuPG?

GnuPG is a complete and free implementation of the OpenPGP standard. GnuPG allows you to encrypt and sign your data and communications; it features a versatile key management system, along with access modules for all kinds of public key directories. GPG can use both symmetric and asymmetric encryption to encrypt and decrypt.

So, now let’s talk about the tool Gpg4Win. Gpg4win is an email and file encryption package for most versions of Microsoft Windows and Microsoft Outlook, which utilizes the GnuPG framework for symmetric and public-key cryptography, such as data encryption, digital signatureshash calculations etc. It’s open source and a free tool, it has been widely used by many of the encryption implementations. So, let’s see how you can install a GnuPG Software.

You can navigate to this GnuPG Download link of the official download page. You can download the latest version, as of writing this blog Gpg4Win 4.2.0 is the latest.

Gpg4win 4.2.0 contains mainly, rest of the components aren’t of interest for this blog:

1.GnuPG 2.4.3 : Actual software used to encrypt and decrypt.

2. Kleopatra 3.1.28: Kleopatra is a certificate manager and GUI for GnuPG, it stores all your certificates and keys.

Choose $0 and proceed to download which now

This now downloads the Gpg4Win software. So once click and start your installation, choose the necessary components required.

You can proceed to select only GnuPG, Kleopatra or both, which installs only GnuPG command line and/or Kleopatra which is a windows utility.

If you choose not to install Kleopatra, it’s ok, you still be able to encrypt and decrypt but only using command line, but if you have Kleopatra, you can use GUI for encryption or decryption.

Once you have installed GnuPG, just open Command Prompt, start entering gpg..

You can also check the root folder where all your Key rings will be stored…

With gpg is now set up in your PC, you will be able to encrypt and decrypt using gpg command line scripts.

Ok, now everything is good, how about if other persons when logged into this PC, will they be able to use the gpg commands to encrypt or decrypt, of course not, for this you need to follow as below…

All you need to set an environment variable which is of scope user and set the home location for gpg to look for keys in that machine.

Once you have set this, the home location of gpg is now changed, so any user who have access to this path can be able to encrypt or decrypt without issues.

You check the modified location by using this command

I hope you have learned something…below this post, I have added the link to the blog post where the encryption and decryption just below this blog post, we will see how you can encrypt and decrypt files using gpg command line utility being called from C#. Any questions do let me know in comments….

Happy Integrating Power Platform with 3rd party Applications.

Cheers,

PMDY

Open Dynamics 365 Model Driven Apps faster with these two tips…Quick Tip

Hi Folks,

With increase in the adoption of Power Platform, the number of Dynamics 365 Model Driven apps are growly rapidly.

Did you ever face any performance issues opening up your App…? These tips if remembered can definitely help you down the road in your implementations.

Tip 1: Want to load your App faster…are you trying to open a URL like this https://ecellorsdev.crm8.dynamics.com/ , then just append main.aspx, this makes your App to load faster.

Tip 2: Are you trying to open the settings page similar to this URL https://ecellorsdev.crm8.dynamics.com/main.aspx?settingsonly=true and it keeps on loading…

Then right click on your browser and choose to duplicate your tab.

Both these techniques, helps your App to resolve quickly…don’t forget to try out and see while working on your projects.

Cheers,

PMDY

3 ways for error handling in Power Automate

While everything is being automated, we will learn how effective you can handle the errors while you automate the process. Ideally when a failure happens in a Power Automate cloud flow, the default behavior is to stop processing. You might want to handle errors and roll back earlier steps in case of failure. Here are 3 basic first hand rules to consider implementing without second thought.

Run after

The way that errors are handled is by changing the run after settings in the steps in the flow, as shown in the following image.

Screenshot showing the run after settings.

Parallel branches

When using the run after settings, you can have different actions for success and failure by using parallel branches.

Screenshot showing the parallel branch with run after.

Changesets

If your flow needs to perform a series of actions on Dataverse data, and you must ensure that all steps work or none of them work, then you should use a changeset.

Screenshot that shows a changeset in flow.

If you define a changeset, the operations will run in a single transaction. If any of the step’s error, the changes that were made by the prior steps will be rolled back.

Special mentions:

  1. Using Scopes – Try, Catch, Finally
  2. Retry policies – Specify how a request should be handled incase failed.
  3. Verify the Power Automate Audit Logs from Microsoft Purview Compliance Portal
  4. Last but not the least – Check the API Limits for the different actions.

Cheers,

PMDY

Calling Command Line Commands from C# – Quick Tip

Hi Folks,

In today’s no code world and AI, while most of the Apps are developed using low code approach, sometimes we have to go with the traditional way of development to handle any integrations with other systems.

When we give anyone Command Line script and ask them to execute, the other person would immediately open Search bar at the bottom available in Windows and start entering cmd. Immediately command prompt window appears and will be able to execute the same command.

But what if we ask to execute command line Commands from C# code…? So, in this blog post, I will show you how easily you can call command line commands with a simple example. Let’s get started…

Here in order to showcase, I will just use a basic command line command and run it from C#.

Everyone knows how to find the ipconfig command right, which just shows the internet protocol configuration when entered in command line like below.

In order to execute it from Console Application using C#, we would need to utilize the System. Diagnostics. You can utilize the below C# code.

using System;
using System.Collections.Generic;
using System.Linq;
using System.Text;
using System.Threading.Tasks;
using System.Diagnostics;
namespace BatchTest
{
class Program
{
static void Main(string[] args)
{
Process pro = new Process();
pro.StartInfo.FileName = "cmd.exe";
pro.StartInfo.CreateNoWindow = true;
pro.StartInfo.RedirectStandardInput = true;
pro.StartInfo.RedirectStandardOutput = true;
pro.StartInfo.RedirectStandardError = true;
pro.StartInfo.UseShellExecute = false;
pro.Start();
pro.StandardInput.WriteLine("ipconfig");
pro.StandardInput.Flush();
pro.StandardInput.Close();
pro.WaitForExit();
Console.WriteLine(pro.StandardOutput.ReadToEnd());
Console.ReadKey();
}
}
}

When we execute this command, it shows exactly same as what we saw above with Command Line.

In the same way we can call any Command Line Commands from C#. I have to use this approach for my Power Platform Implementation integration to decrypt encrypted messages using PGP and I found it to be very helpful and thought of sharing with all of you. If you were looking for a program to decrypt, you can check out for previous blog post here.

Cheers,

PMDY

Unable to persist the profile – Quick Tip

Hi Folks,

Are you debugging the Dynamics 365 Plugins using Plugin Profiler, did you ever notice this problem that you were unable to persist profile so as to debug your plugin. Did you got frustrated as you couldn’t capture the profile even after lot of tries installing and uninstalling the profiler. Just read on. I am writing this blog post after fixing a similar situation with one of my Plugin.

First of all, I would advise you to check the below.

  1. Plugin trace log under Settings –> Plugin Trace Log.
  2. Check if your Plugin is being called multiple number of times
  3. Check the filtering attributes of your Plugin whether it is causing to go in an infinite loop
  4. Suppose if you have added an image, did you select the respective attributes of the image
  5. Did you add sufficient depth conditions to prevent infinite loop executions.
  6. At what step is your plugin running, is it in PreOperation, PostOperation.? In case you were throwing an error, change it to Prevalidation step and check.
  7. Were you using persist to entity option while debugging, try changing to throw an error and see.
  8. If you note that the system becomes unresponsive and you were not able to download the log file, then definitely your logic is getting called multiple times. Please reverify.

Once you have verified these, you should be able to find out the exact root cause of the issue…I will leave to yourself.

Thank you…and enjoy debugging…Power Platform Solutions…

Cheers,

PMDY

Connecting to your Dataverse instance to run SQL Queries without using XrmToolBox

Hi Folks,

Do you know that you can connect to your Dataverse DB right from your old toolbox SSMS, an express version would be more than enough to try out. Possibly we didn’t think of, but yes, we can…so let’s see that in this blog post.

Open SSMS..

1.Select Server type as Database Engine

2. Server name as the environment URL from your Power Platform Admin Center as below.

3. So key in those details as below, make sure to Select Authentication method as Azure Active Directory – Universal with MFA option.

Once you click on Connect, you will be prompted for authentication via browser.

Once your Sign-In is successful, you will be able to see.

That’s it, how simple it was connecting to your Dataverse instances…

Having said that it’s easy to connect to Dataverse, not all operations performed using normal transact SQL are supported here using Dataverse SQL. You could see it says Read-Only besides the instance name, that means that you don’t have any capabilities to modify from SQL.

Because Dataverse SQL is a subset of Transact-SQL. If you want to see what statements are supported and what not, just go ahead to this link to find out.

This opens a whole lot of opportunities to explore, so don’t forget to check this out.

References:

Dataverse SQL and Transact SQL

Cheers,

PMDY

Show last refreshed time for your Power BI Reports in Import Mode – Quick Tip

Hi Folks,

If you are working on Power BI, this is a good to know tip.

In case you were using Import mode which is by default suggested by Microsoft for medium or small-scale datasets as it uses Vertipaq engine for improved performance and compression, this post is definitely for you.

Did your user ever asked why they were not able to see latest data in the report. Possibly you could have said it is because of refresh frequency.

Then you could have thought if there was a nice way to show when the dataset was last refreshed. This definitely help your users to have a clear idea of what’s going on.

FYI, the refresh frequency could be set in Power BI service as below for import mode.

In your Power BI report, click on Transform data.

Click on New Source –> Blank Query as below.

In the Query Fx expression…. enter the below expression to get the last refresh time and click on Tick symbol.

Next, click on To Table to create a table from this data as below.

Rename it to something meaningful like below.

Rename the Query1 variable as below..you should see the applied steps getting added for each operation you performed.

DateTime.LocalNow() gets the last refresh frequency of your dataset in your local time.

Click on Close & Apply

Now in your report, just add a card visual at the bottom right corner and drag the Last Refreshed On query.

That’s it, next time onwards, you should see the date and time when the refresh had occurred.

Cheers,

PMDY

Create a Custom Connector for your Web API from within Visual Studio

Hi Folks,

In this blog post, let’s see how we can create a custom connector without leaving our own Visual Studio for building a custom connector. Ideally for building any custom connector, we need to create them in https://make.powerapps.com or https://make.powerautomate.com. Last month Microsoft Announced that Power Platform is now a connected service in Visual Studio 2022. In this blog, we will utilize its capability…

Before diving deeper, let’s see what are the prerequisites..

  1. Visual Studio
  2. ASP .NET Web API knowledge
  3. Canvas Apps knowledge

Let’s get started..

Step 1:

Create ASP.NET Web API Project in Visual Studio

Step 2:Choose your option as below and click on Next..

Step 3:

Choose your next steps as below and click on Next to proceed, make sure to choose authentication type as None

Step 4:

Create a ASP.NET Core Web API Project

Step 5:

By adding Power Platform as a service dependency, you can update an existing custom connector, or create a new one from your API.

If you want to expose your local running API to a public endpoint, I prefer using Dev Tunnels feature of Visual Studio…

That’s it, you have started running your API.

Step 6:

Now let’s create a Mobile App with Power Apps…with the same login you have used for the Visual Studio to create a custom connector..

Step 7:

First check if Custom Connector has been created in your tenant and authenticate the connection….navigate to https://make.powerapps.com and click on Discover at the left of the page….and then click on Custom Connectors, you should see a connector which we created from Visual Studio….nice isn’t it…

Step 8:

All you need to create a connection by clicking on the + sign available..

Once connected, now try creating a mobile Canvas App..

In the Canvas App, try adding data…and search for Weather Sample which you created, you should see something like below…

Step 9:

Once the web API is running in your development environment, you can debug in real time and even Hot Reload your code.

References:

https://learn.microsoft.com/en-us/aspnet/core/test/dev-tunnels?view=aspnetcore-7.0#create-a-tunnel

Thank you for reading…

Cheers,

PMDY