3 ways for error handling in Power Automate

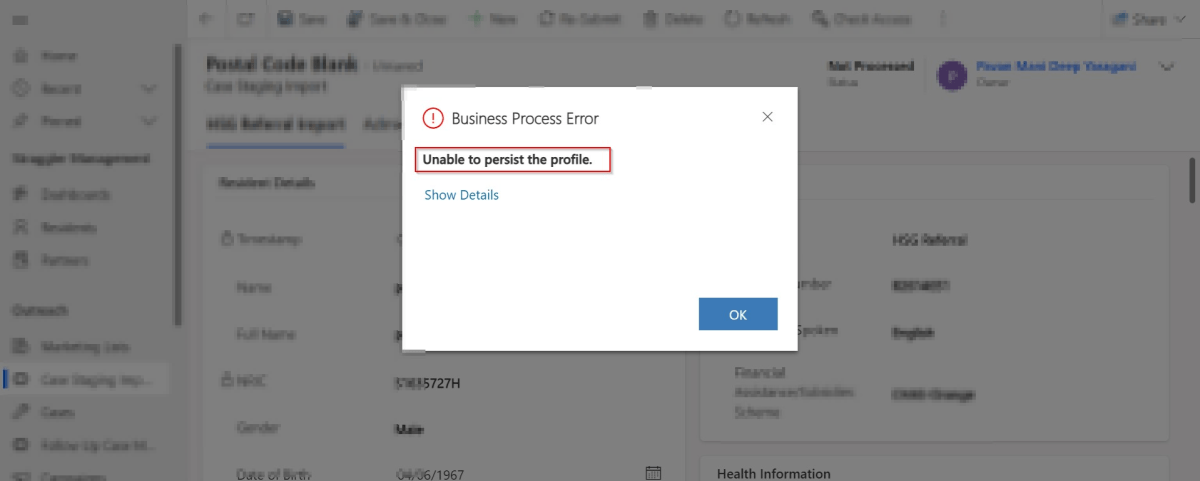
While everything is being automated, we will learn how effective you can handle the errors while you automate the process. Ideally when a failure happens in a Power Automate cloud flow, the default behavior is to stop processing. You might want to handle errors and roll back earlier steps in case of failure. Here are 3 basic first hand rules to consider implementing without second thought.

Run after

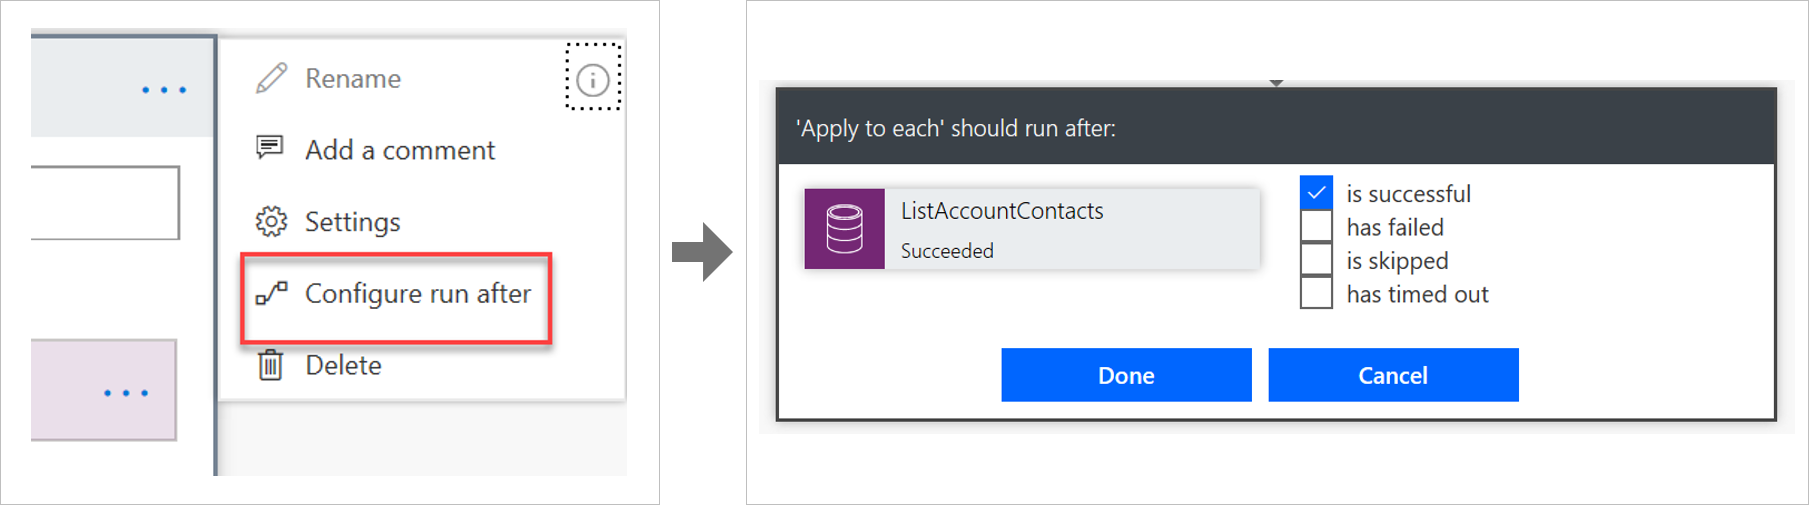
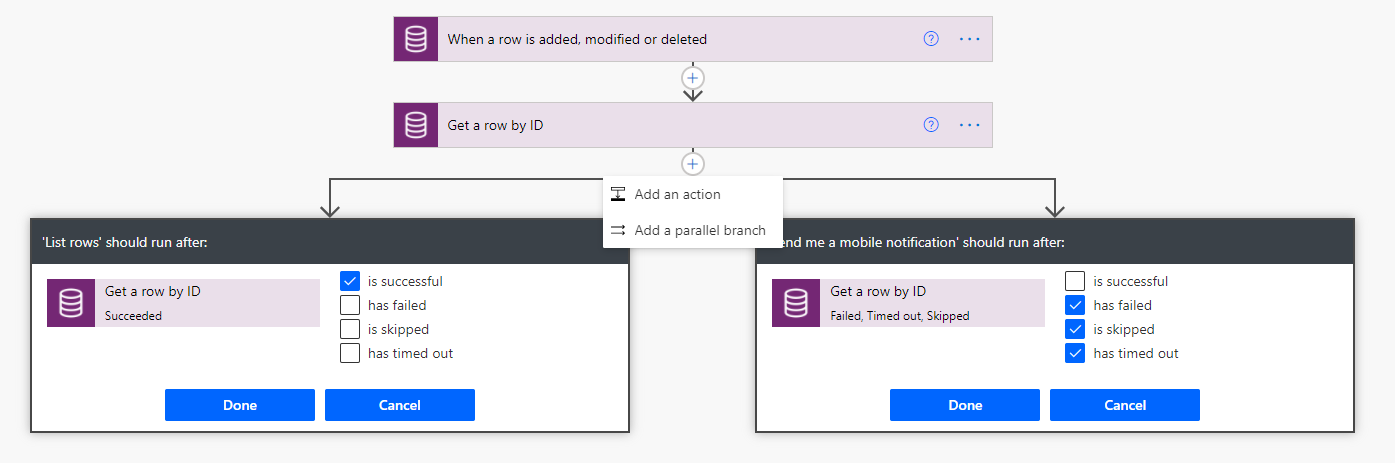
The way that errors are handled is by changing the run after settings in the steps in the flow, as shown in the following image.

Screenshot showing the run after settings.

Parallel branches

When using the run after settings, you can have different actions for success and failure by using parallel branches.

Screenshot showing the parallel branch with run after.

Changesets

If your flow needs to perform a series of actions on Dataverse data, and you must ensure that all steps work or none of them work, then you should use a changeset.

Screenshot that shows a changeset in flow.

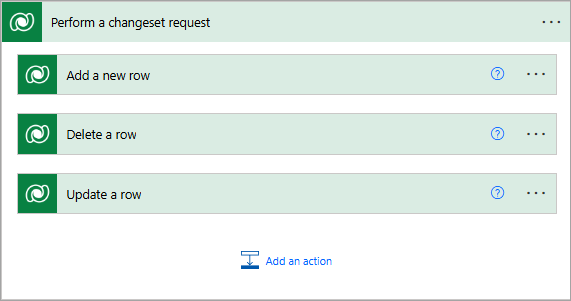
If you define a changeset, the operations will run in a single transaction. If any of the step’s error, the changes that were made by the prior steps will be rolled back.

Special mentions:

  1. Using Scopes – Try, Catch, Finally
  2. Retry policies – Specify how a request should be handled incase failed.
  3. Verify the Power Automate Audit Logs from Microsoft Purview Compliance Portal
  4. Last but not the least – Check the API Limits for the different actions.

Cheers,

PMDY

Calling Command Line Commands from C# – Quick Tip

Hi Folks,

In today’s no code world and AI, while most of the Apps are developed using low code approach, sometimes we have to go with the traditional way of development to handle any integrations with other systems.

When we give anyone Command Line script and ask them to execute, the other person would immediately open Search bar at the bottom available in Windows and start entering cmd. Immediately command prompt window appears and will be able to execute the same command.

But what if we ask to execute command line Commands from C# code…? So, in this blog post, I will show you how easily you can call command line commands with a simple example. Let’s get started…

Here in order to showcase, I will just use a basic command line command and run it from C#.

Everyone knows how to find the ipconfig command right, which just shows the internet protocol configuration when entered in command line like below.

In order to execute it from Console Application using C#, we would need to utilize the System. Diagnostics. You can utilize the below C# code.

using System;
using System.Collections.Generic;
using System.Linq;
using System.Text;
using System.Threading.Tasks;
using System.Diagnostics;
namespace BatchTest
{
class Program
{
static void Main(string[] args)
{
Process pro = new Process();
pro.StartInfo.FileName = "cmd.exe";
pro.StartInfo.CreateNoWindow = true;
pro.StartInfo.RedirectStandardInput = true;
pro.StartInfo.RedirectStandardOutput = true;
pro.StartInfo.RedirectStandardError = true;
pro.StartInfo.UseShellExecute = false;
pro.Start();
pro.StandardInput.WriteLine("ipconfig");
pro.StandardInput.Flush();
pro.StandardInput.Close();
pro.WaitForExit();
Console.WriteLine(pro.StandardOutput.ReadToEnd());
Console.ReadKey();
}
}
}

When we execute this command, it shows exactly same as what we saw above with Command Line.

In the same way we can call any Command Line Commands from C#. I have to use this approach for my Power Platform Implementation integration to decrypt encrypted messages using PGP and I found it to be very helpful and thought of sharing with all of you. If you were looking for a program to decrypt, you can check out for previous blog post here.

Cheers,

PMDY

Unable to persist the profile – Quick Tip

Hi Folks,

Are you debugging the Dynamics 365 Plugins using Plugin Profiler, did you ever notice this problem that you were unable to persist profile so as to debug your plugin. Did you got frustrated as you couldn’t capture the profile even after lot of tries installing and uninstalling the profiler. Just read on. I am writing this blog post after fixing a similar situation with one of my Plugin.

First of all, I would advise you to check the below.

  1. Plugin trace log under Settings –> Plugin Trace Log.
  2. Check if your Plugin is being called multiple number of times
  3. Check the filtering attributes of your Plugin whether it is causing to go in an infinite loop
  4. Suppose if you have added an image, did you select the respective attributes of the image
  5. Did you add sufficient depth conditions to prevent infinite loop executions.
  6. At what step is your plugin running, is it in PreOperation, PostOperation.? In case you were throwing an error, change it to Prevalidation step and check.
  7. Were you using persist to entity option while debugging, try changing to throw an error and see.
  8. If you note that the system becomes unresponsive and you were not able to download the log file, then definitely your logic is getting called multiple times. Please reverify.

Once you have verified these, you should be able to find out the exact root cause of the issue…I will leave to yourself.

Thank you…and enjoy debugging…Power Platform Solutions…

Cheers,

PMDY

Connecting to your Dataverse instance to run SQL Queries without using XrmToolBox

Hi Folks,

Do you know that you can connect to your Dataverse DB right from your old toolbox SSMS, an express version would be more than enough to try out. Possibly we didn’t think of, but yes, we can…so let’s see that in this blog post.

Open SSMS..

1.Select Server type as Database Engine

2. Server name as the environment URL from your Power Platform Admin Center as below.

3. So key in those details as below, make sure to Select Authentication method as Azure Active Directory – Universal with MFA option.

Once you click on Connect, you will be prompted for authentication via browser.

Once your Sign-In is successful, you will be able to see.

That’s it, how simple it was connecting to your Dataverse instances…

Having said that it’s easy to connect to Dataverse, not all operations performed using normal transact SQL are supported here using Dataverse SQL. You could see it says Read-Only besides the instance name, that means that you don’t have any capabilities to modify from SQL.

Because Dataverse SQL is a subset of Transact-SQL. If you want to see what statements are supported and what not, just go ahead to this link to find out.

This opens a whole lot of opportunities to explore, so don’t forget to check this out.

References:

Dataverse SQL and Transact SQL

Cheers,

PMDY

Show last refreshed time for your Power BI Reports in Import Mode – Quick Tip

Hi Folks,

If you are working on Power BI, this is a good to know tip.

In case you were using Import mode which is by default suggested by Microsoft for medium or small-scale datasets as it uses Vertipaq engine for improved performance and compression, this post is definitely for you.

Did your user ever asked why they were not able to see latest data in the report. Possibly you could have said it is because of refresh frequency.

Then you could have thought if there was a nice way to show when the dataset was last refreshed. This definitely help your users to have a clear idea of what’s going on.

FYI, the refresh frequency could be set in Power BI service as below for import mode.

In your Power BI report, click on Transform data.

Click on New Source –> Blank Query as below.

In the Query Fx expression…. enter the below expression to get the last refresh time and click on Tick symbol.

Next, click on To Table to create a table from this data as below.

Rename it to something meaningful like below.

Rename the Query1 variable as below..you should see the applied steps getting added for each operation you performed.

DateTime.LocalNow() gets the last refresh frequency of your dataset in your local time.

Click on Close & Apply

Now in your report, just add a card visual at the bottom right corner and drag the Last Refreshed On query.

That’s it, next time onwards, you should see the date and time when the refresh had occurred.

Cheers,

PMDY

Create a Custom Connector for your Web API from within Visual Studio

Hi Folks,

In this blog post, let’s see how we can create a custom connector without leaving our own Visual Studio for building a custom connector. Ideally for building any custom connector, we need to create them in https://make.powerapps.com or https://make.powerautomate.com. Last month Microsoft Announced that Power Platform is now a connected service in Visual Studio 2022. In this blog, we will utilize its capability…

Before diving deeper, let’s see what are the prerequisites..

  1. Visual Studio
  2. ASP .NET Web API knowledge
  3. Canvas Apps knowledge

Let’s get started..

Step 1:

Create ASP.NET Web API Project in Visual Studio

Step 2:Choose your option as below and click on Next..

Step 3:

Choose your next steps as below and click on Next to proceed, make sure to choose authentication type as None

Step 4:

Create a ASP.NET Core Web API Project

Step 5:

By adding Power Platform as a service dependency, you can update an existing custom connector, or create a new one from your API.

If you want to expose your local running API to a public endpoint, I prefer using Dev Tunnels feature of Visual Studio…

That’s it, you have started running your API.

Step 6:

Now let’s create a Mobile App with Power Apps…with the same login you have used for the Visual Studio to create a custom connector..

Step 7:

First check if Custom Connector has been created in your tenant and authenticate the connection….navigate to https://make.powerapps.com and click on Discover at the left of the page….and then click on Custom Connectors, you should see a connector which we created from Visual Studio….nice isn’t it…

Step 8:

All you need to create a connection by clicking on the + sign available..

Once connected, now try creating a mobile Canvas App..

In the Canvas App, try adding data…and search for Weather Sample which you created, you should see something like below…

Step 9:

Once the web API is running in your development environment, you can debug in real time and even Hot Reload your code.

References:

https://learn.microsoft.com/en-us/aspnet/core/test/dev-tunnels?view=aspnetcore-7.0#create-a-tunnel

Thank you for reading…

Cheers,

PMDY

Dataverse Low Code Plugins – Insight

Prerequisite: Intall Dataverse Accelerator from AppSource from Microsoft Power CAT Team. Follow along once you have installed…see Dataverse Accelerator Installation Post if you want to know how..

Firstly, open the environment from https://make.powerapps.com where you would like to test this out, install the Dataverse Accelerator Solution as described above.

You should see there is an option to create Plugin from UI itself, no need to open Visual Studio and write your .Net Class library and register using Plugin Registration tool.

Please note that this is still an Experimental Feature and lot of improvements yet to be made..below is my quick test on basic CRUD Operation using this Plugin..

There were two types of Low Code Plugins

  1. Instant Plugins
  2. Automated Plugins

Let’s see how they work by creating an Instant Plugin

Step 1: Click on New Plugin Button available

Step 2: Key in the display name and description, both are mandatory to be entered…we don’t have a way to customize here as of now…

Step 3:Then Click on Next and enter the Parameters in the Definition area…I just mentioned In and Out parameters for brevity, then added a simple expression to multiply the input variable supplied by 100…

Make sure you won’t get any errors

Step 4: Then click on Next and click on Save.

Step 5:Once Saved, you will get a new button for testing…

Step 6:Clicking on Test will get you to the below screen to enter your input parameter…

Step 7:Clicking on Run which gives the output in Web API and highlighted is the response received with a success.

Note:

For some of the Automated Plugins, got a failure message with no way to troubleshoot what was the error was…I have raised this to Microsoft, but they mentioned that these features are work in Progress…

Hope we get all the complex functionality there in Dynamics 365 CE Plugins be available within Dataverse Low Code Plugins with the help of Power Fx too in future….the App development is going to be lot more easier…with Microsoft Power Platform… and citizen developers can pitch in…

Reference: Dataverse Low Code Plugins Repo in GIT Hub

Thank you for reading…

Cheers,

PMDY

Install Dataverse Accelerator App from AppSource

Subscribe to continue reading

Subscribe to get access to the rest of this post and other subscriber-only content.

Getting started with creating a flow using Copilot in Power Automate

Subscribe to continue reading

Subscribe to get access to the rest of this post and other subscriber-only content.

What’s Rebase and Merge in Azure Devops…Quick Recap

Hi Folks,

Yesterday I was working with Azure DevOps repository for my project. My local Develop branch is behind the Main branch by few commits, I want to get the latest commits into my local and include those from the Main branch also in to my Develop branch.

It is then I got to know whether to use GIT Merge Command or GIT Rebase Command. And here you go my findings on the same….

I got to know the details, official Git manual states that rebase “reapplies commits on top of another base branch”, whereas merge “joins two or more development histories together”. In other words, the key difference between merge and rebase is that while merge preserves history as it happened, rebase rewrites it. Let’s start with an illustration…for better understanding…followed by the differences…

MergeRebase
Git merge is a command that allows you to merge branches from Git.Git rebase is a command that allows developers to integrate changes from one branch to another.
In Git Merge logs will be showing the complete history of the merging of commits.Logs are linear in Git rebase as the commits are rebased 
All the commits on the feature branch will be combined as a single commit in the master branch.All the commits will be rebased and the same number of commits will be added to the master branch.
Git Merge is used when the target branch is shared branchGit Rebase should be used when the target branch is private branch

Actually talking both do mean the same purpose and have their own uses, but at the end of the day it is completely up to your ALM strategy/methodology. I preferred to use Merge instead of Rebase just that my branch is shared branch and for simplicity.

Hope this helps…

Cheers,

PMDY