Establishing tenant hygiene with the CoE Starter Kit – Learn COE #04

Hi Folks,

In this blog post, I am going to talk about establishing tenant hygiene using COE Stater kit, in today’s world where there increasing Power Platform demand. Organizations have become mature, that every implementation is now looking for having some kind of governance being established.

If you were some one who want to get some knowledge of implementing governance, you were at right place.

In order to efficiently implement governance, we need to understand the environment strategy, your current implementation has used. Of course if you were looking for some guidance, there were examples of tooling available in the CoE Starter Kit and out-of-the-box capabilities to help CoE teams effectively manage and optimize their Power Platform solutions.

Few key steps to be considered for maintaing this in your environment, so let’s get started…

  1. Define Environment Strategy
  • Assign your admins the Power Platform service admin or Dynamics 365 service admin role.
  • Restrict the creation of net-new trial and production environments to admins
  • Rename the default environment to ‘Personal Productivity’
  • Provision a new Production environment for non-personal apps/flows
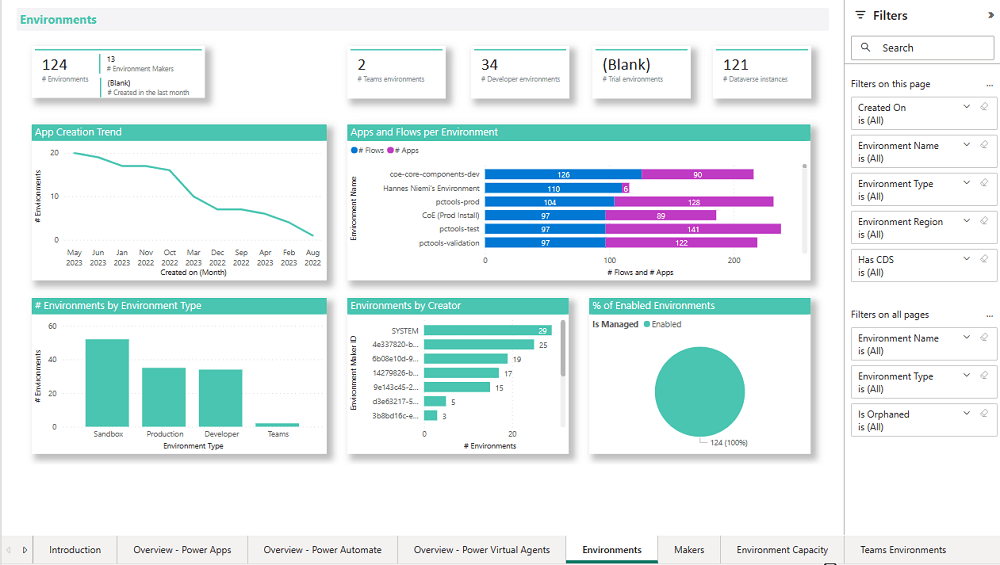
  • Define and implement your DLP policies for your environments
  • When establishing a DLP strategy, you may need multiple environments for the same department
  • When establishing your Power Platform environment strategy, based upon your licensing, you may find that you need to provision environments without a Dataverse (previously called Common Data Service) database and also use DLP policies to restrict the use of premium connectors.
  • Establish a process for requesting access or creation of environments
  • Dev/Test/Production environments for specific business groups or application
  • Individual-use environments for Proof of Concepts and training workshops
  • Use a service account to deploy production solutions
  • Reduce the number of shared development environments
  • Share resources with Microsoft Entra Security Groups.

2. Compliance and Adoption:

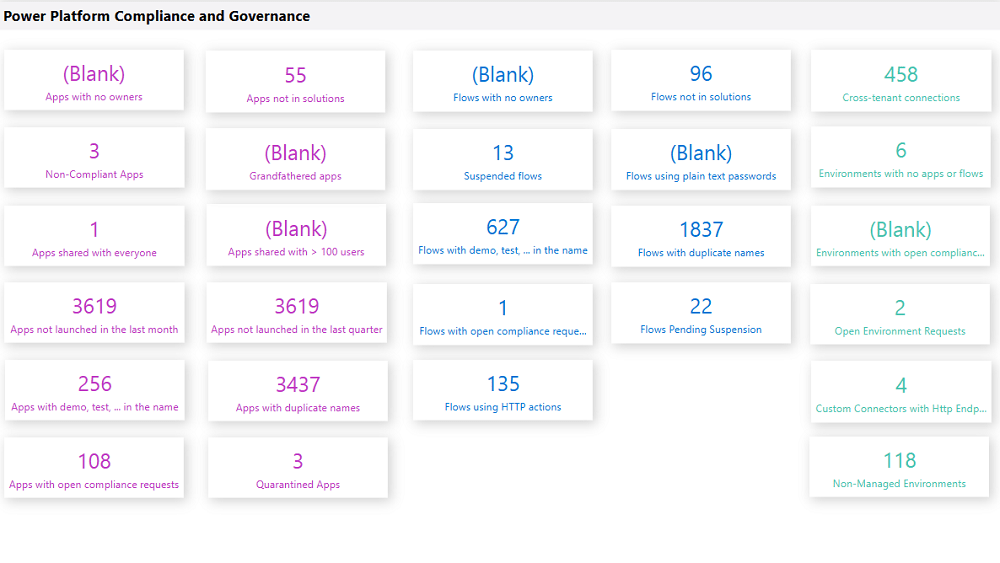
The Compliance page in the CoE Starter Kit’s Compliance and adoption dashboard can help you identify apps and flows with no owners, noncompliant apps, and suspended flows.
  • Rename and secure the default environment
  • Identify unused apps, pending suspension, suspended cloud flows and not without an owner or not in solutions
  • Quarantined noncompliant apps and clean up orphaned resources
  • Enable Managed Environments and establish a data loss prevention policy
  • Apply cross tenant isolation
  • Assign Administrator roles appropriately
  • Apps and flows with duplicate names not compliant with DLP policies or billing policies
  • Apps shared with everyone and apps shared with more than 100 users and Apps not launched in the last month and in the last quarter
  • Flows using plain text passwords and using HTTP actions
  • Cross-tenant connections
  • Environments with no apps or flows
  • Custom connectors using HTTP environments

3. Managing Dataverse for Teams environments

If you were not using Dataverse for Teams, you can safely skip this step, else please review

The Microsoft Teams environments page in the CoE Starter Kits dashboard provides you with an overview of your existing Teams environments, apps and flows in those environments, and the last launched date of apps.
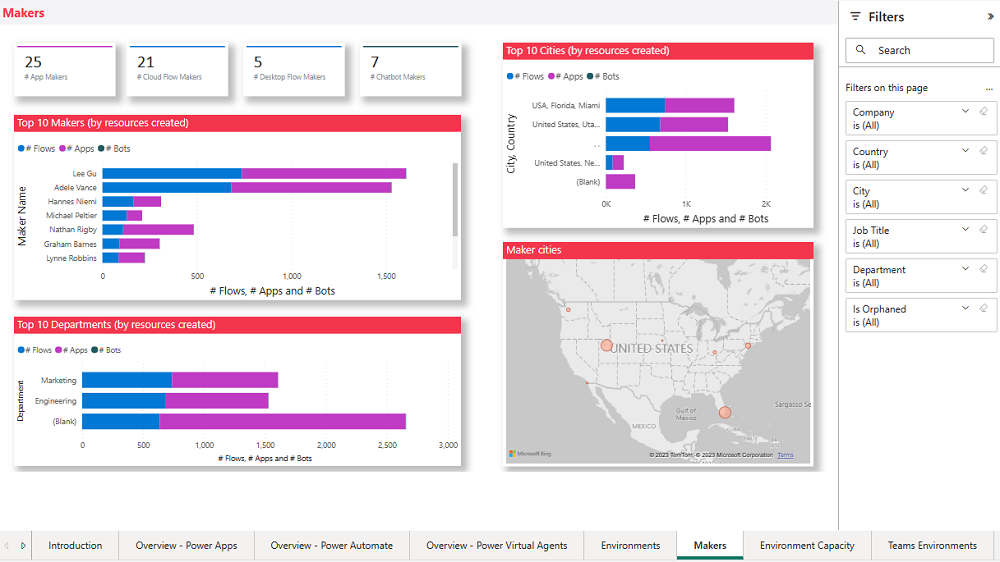
Screenshot of a Microsoft Teams Environments overview.

By checking for new Dataverse for Teams environments daily, organizations can ensure they’re aware of all environments in use. 

State of Dataverse for TeamsPower Platform action
83 days after no user activitySend a warning that the environment will be disabled. Update the environment state on the Environments list page and the Environment page.
87 days after no user activitySend a warning that the environment will be disabled. Update the inactive environment state on the Environments list page and the Environment page.
90 days after no user activityDisable the environment. Send a notice that the environment has been disabled. Update the disabled environment state on the Environments list page and the Environment page.
113 days after no user activitySend a warning that the environment will be deleted. Update the disabled environment state on the Environments list page and the Environment page.
117 days after no user activitySend a warning that the environment will be deleted. Update the disabled environment state on the Environments list page and the Environment page.
120 days after no user activityDelete the environment. Send a notice that the environment has been deleted.

Please note a warning is displayed only if the Dataverse for Teams environment is <= 7 days until disablement.

4. Highly used apps

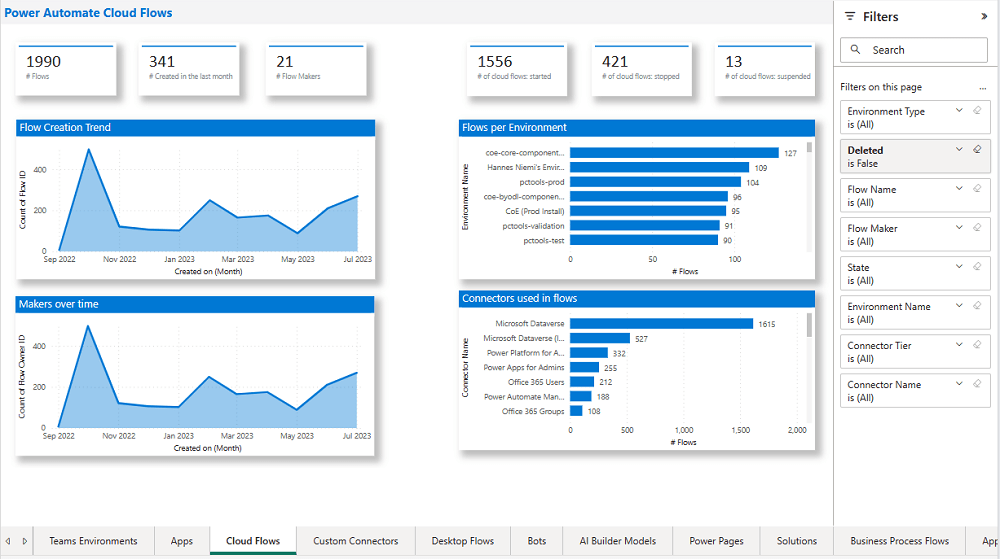
The Power BI Dashboard available out of the box with COE Starter Kit will provide you the necessary guidance over high performing apps and also your most active users.
5. Communicating governance to your makers

This is one of the important step while setting up COE and governance guidelines, follow the below approaches

  • Clearly communicate the purpose and benefits of governance policies:Explain how governance policies protect organizational data
  • Make governance policies and guidelines easily accessible:Place the policies and guidelines in a central location that is easily accessible to all makers
  • Provide training and support:Offer training sessions and resources to help makers understand and comply with governance policies.
  • Encourage open communication: Foster culture where makers can ask questions and raise concerns about governance policies.
  • Incorporate governance into the development process:For example, you can require a compliance review before deploying a solution.

6. Administration of the platform

Power Platform Administrator Planning Tool which comes with COE Strater Kit provides guidance and best practices for administration. Also the planning tool can optimize environments, security, data loss prevention, monitoring and reporting.

6. Securing the environments

It is critical to establish a Data Loss Prevention (DLP) strategy to control connector availability.
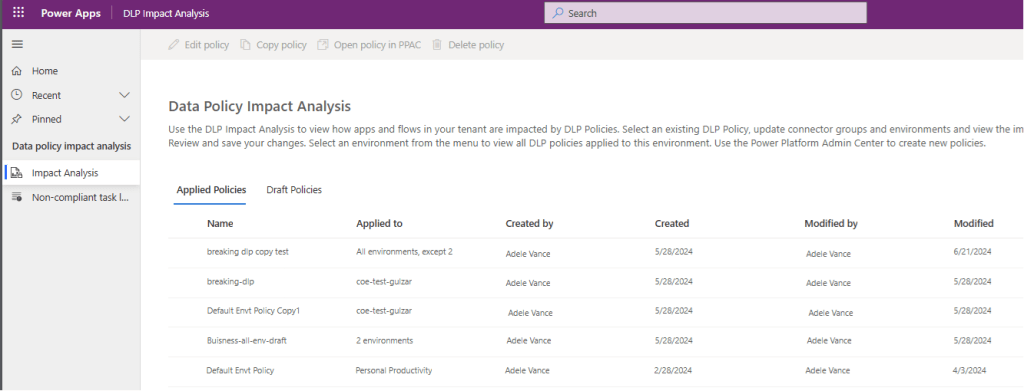
The DLP editor (impact analysis) tool is available for use before making changes to existing policies or creating new DLP policies. It reveals the impact of changes on existing apps and cloud flows and helps you make informed decisions.

Reference: COE Starter Kit Documentation

If you face issues using the COE Starter Kit, you can always report them at https://aka.ms/coe-starter-kit-issues

Hope this helps…. someone maintaining tenant governance with COE starter kit…. if you have any feedback or questions, do let me know in comments….

Cheers,

PMDY

Visualize this view – what this mean to developers and end users…?

Hi Folks,

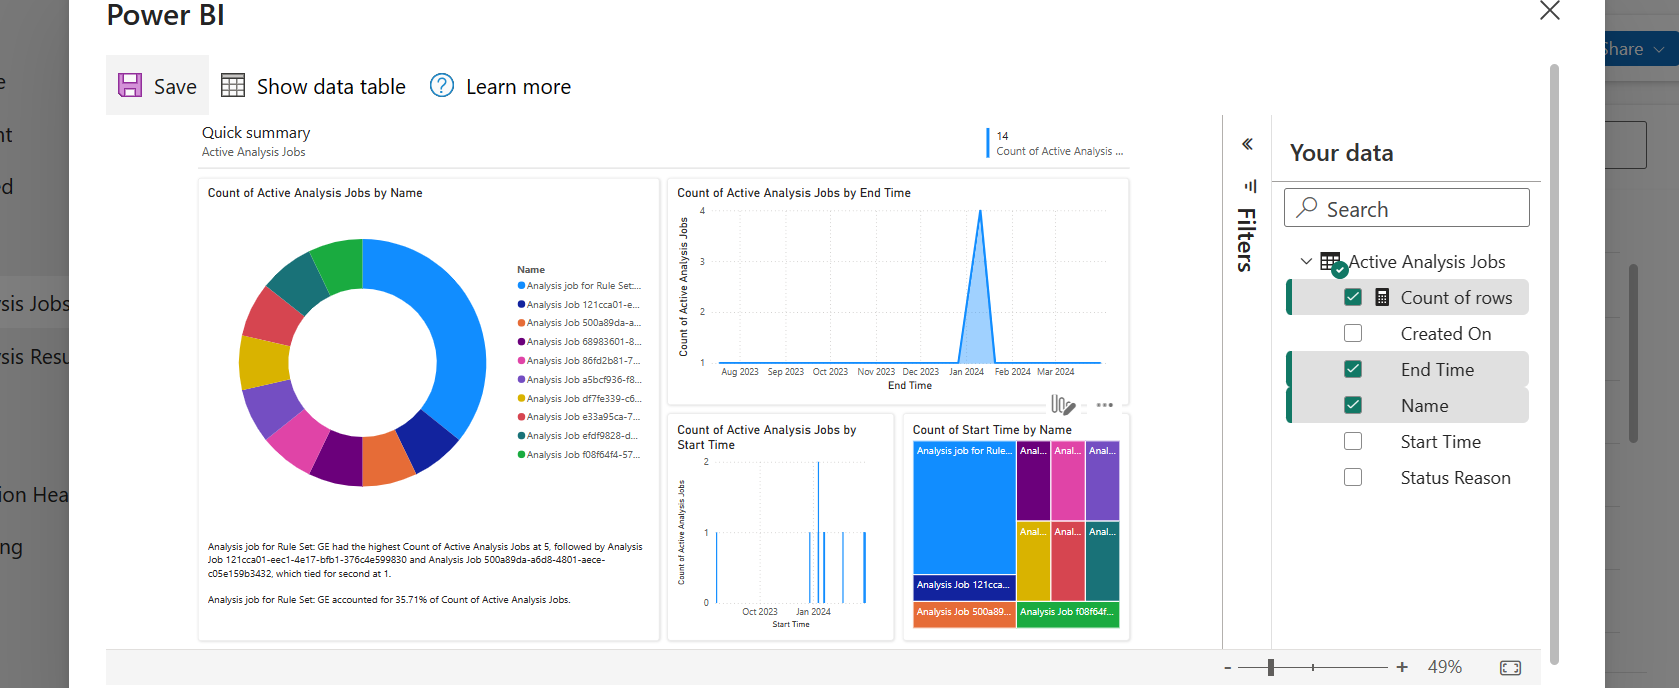
Have you noticed Visualize this view button in in the app bar of any grid view of Dynamics 365?

Here is a dashboard built within couple of minutes. While this can greatly help end users visualize the data present in the system. So, in this post, let’s understand bit more details about this capability and what are the some of the features which are left behind.

Let’s understand the how’s this is generated along with its capabilities and disadvantages compared to traditional Power BI dashboard both from Developer and end user perspective, please note that this is my understanding..

For Developers:

a. Visualize this view uses a PCF Control which calls the Power BI REST API and then generates the embed token for the report embedding that into an Iframe.

b. Then uses Power BI JavaScript API to handle user interactions with the embedded report such as filtering or highlighting data points.

c. When Power BI first generates your report, it takes a look through your data to identify patterns and distributions and pick a couple of fields to use as starting points for creating the initial set of visuals when data is not preselected.

d. Any changes to the data fields calls the UpdateView of the PCF Control and there by passing the updated data fields to REST API and then displays the visuals.

e. Visuals will be created with both selected and non-selected fields which are the related to the selected fields in the data pane.

For End Users & Developers:

Advantages:

  1. Visuals are generated when no data is selected
  2. Cross Highlighting is possible
  3. Click on the Report to see Personalize this visual option
  4. People with Contributor, Member, or Admin role assigned can save the Report to workspace
  5. Users with no access to Power BI cant view this feature, they can request for free Power BI License
  6. Free License users can save the Report to thier personal workspace
  7. Users get build permission when any role above Contributor is assigned and reshare permission is given
  8. The report will be saved as direct query with SSO enabled and honours dataverse settings
  9. Show data table presents a list of tables if the model comprises of multiple tables.
  10. Able to specify the aggregation for each of the field in the model.

Disadvantages:

  1. Only able to export summarized data from Visuals, you will be able to export the data in table from data table.
  2. Only Visual Level, no page level or report level filters
  3. During these reports creation, the model is configured to use Direct Query with Single Sign On.
  4. Embed a report on a Dataverse form requires modifying the XML of the solution
  5. Report published into the workspace are available to download but downloaded reports will not be able to customize further in Power BI Desktop as it would be built using Native Queries.
  6. If the page is kept ideal for long time or the user navigates to other browser window, the session and report will be lost.

Considerations & Limitations:

  1. Power BI Pro license is required to create these reports
  2. While this is wonderful for end users to visualize the data but this is not an alteranative to building reports using Power BI Desktop.

Hope this helps.

Cheers,

PMDY

Dataverse Accelerator | API playground (Preview)

Hi Folks,

In this post, I will be talking about the features of Dataverse Accelerator in brief. Actually, the Microsoft Dataverse accelerator is an application that provides access to select preview features and tooling related to Dataverse development, it is based on Microsoft Power Pages. This is totally different from Dataverse Industry Accelerator.

Dataverse accelerator app is automatically available in all new Microsoft Dataverse environments. If your environment doesn’t already have it, you can install the Dataverse accelerator by going to Power Platform Admin Center –> Environments –> Dynamics 365 Apps –> Install App –> Choose Dataverse Accelerator

You can also refer to my previous blog post on installing it here if you prefer

Once installed, you should see something like below under the Apps

On selection of the Dataverse Accelerator App, you should see something like below, do note that you must have App-level access to the Dataverse accelerator model driven app, such as system customizer or direct access from a security role.

Now let’s quickly see what are features available with Dataverse Accelerator

FeatureDescription
Low-code plug-insReusable, real-time workflows that execute a specific set of commands within Dataverse. Low-code plug-ins run server-side and are triggered by personalized event handlers, defined in Power Fx.
Plug-in monitorA modern interface to surface the existing plug-in trace log table in Dataverse environments, designed for developing and debugging Dataverse plug-ins and custom APIs.
Do you remember viewing Plugin Trace logs from customizations, now you don’t need system administrator role to view trace logs, giving access to this app will do, rest everything remains the same.
API PlaygroundA preauthenticated software testing tool which helps to quickly test and play with Dataverse API’s.

I wrote a blog post earlier on using Low Code Plugins, you may check it out here, while using Plugin Monitor is pretty straight forward.

You can find my blog post on using Postman to test Dataverse API’s here.

Now let’s see how can use the API Playground, basically you will be able to test the below from API Playground similar to Postman. All you need to open the API Playground from Dataverse accelerator. You will be preauthenticated while using API Playground.

TypeDescription
Custom APIThis includes any Dataverse Web API actionsfunctions from Microsoft, or any public user-defined custom APIs registered in the working environment.
Instant plug-inInstant plug-ins are classified as any user-defined workflows registered as a custom API in the environment with a related Power Fx Expressions.
OData requestAllows more granular control over the request inputs to send OData requests.

Custom API, Instant Plugin – You select the relevant request in the drop down available in API Playground and provide the necessary input parameters if required for your request

OData request – Select OData as your request and provide the plural name of the entity and hit send

After a request is sent, the response is displayed in the lower half of your screen which would be something like below.

OData response

I will update this post as these features get released in my region(APAC), because at the time of writing this blog post, this API Playground feature is being rolled out globally and was still in preview.

The Dataverse accelerator isn’t available in GCC or GCC High environments.

Hope learned something about Dataverse Accelerator.

Cheers,

PMDY

Restore deleted records in Dataverse table – Quick Review

Hi Folks,

Have you or your user ever mistakenly deleted records in Model Driven Apps..? Do you remember we can recover the deleted records from recycle bin in your PC, now similarly we can also do this in Dataverse also.

In this blog post, I will discuss about how you can retrieve a deleted record in Dataverse.

Till now, we have following tools in XRMToolBox wherein we can restore the deleted records (https://www.xrmtoolbox.com/plugins/DataRestorationTool, https://www.xrmtoolbox.com/plugins/NNH.XrmTools.RestoreDeletedRecords, https://www.xrmtoolbox.com/plugins/BDK.XrmToolBox.RecycleBin) but wait, these tools require Auditing to be enabled for the concerned table. What if you don’t have auditing enabled for that…now we have a preview feature which comes as a saviour where you don’t need any external tools anymore to restore them.

To use this, just enable this feature from Power Platform Admin Center, you can optionally set the recovery interval if you wish to.

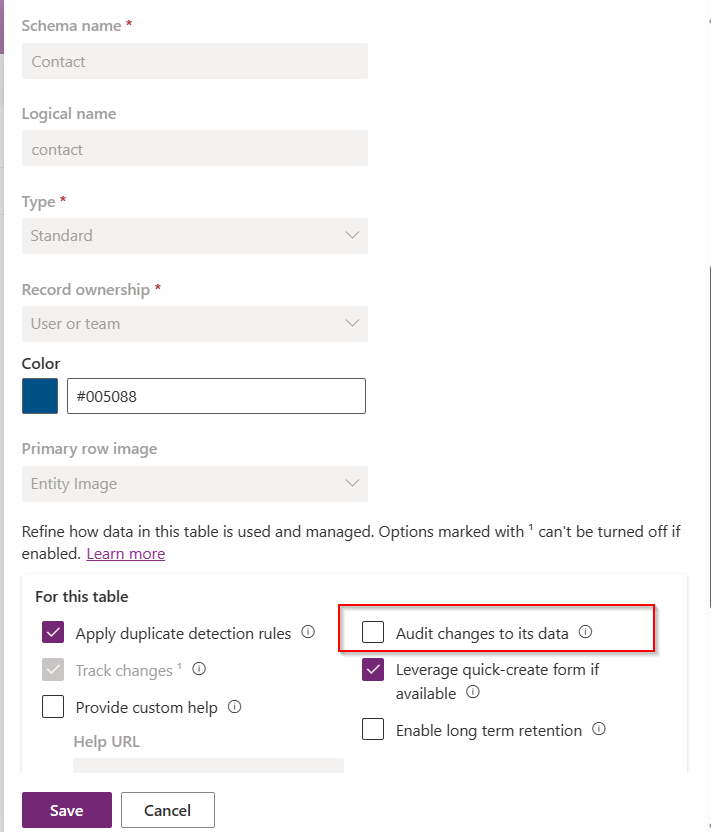
For this, we take Contact table as example, now let’s check the audit setting of the contact table..well, it’s turned off.

Even the auditing is not enabled for the contact entity, with this Recycle Bin Preview feature, we should be able to recover the records, let’s see this in action.

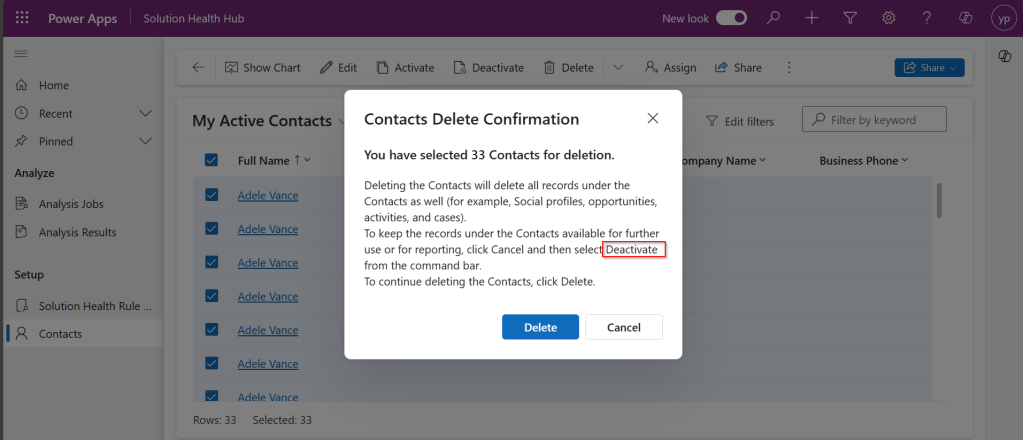
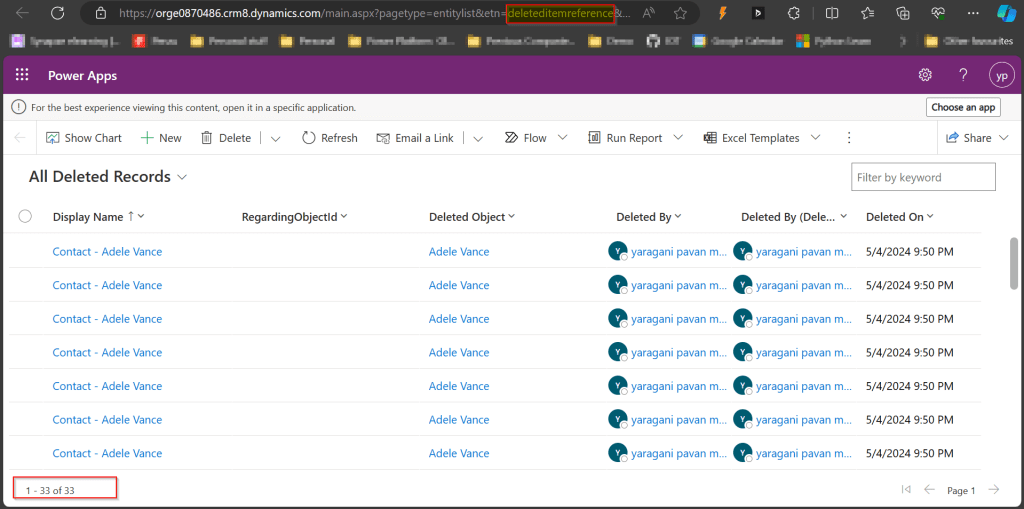
Now try deleting the contact records, I have 33 contact records in my environment, let me delete all of them.

It suggests you deactivate rather than delete, still let’s delete them.

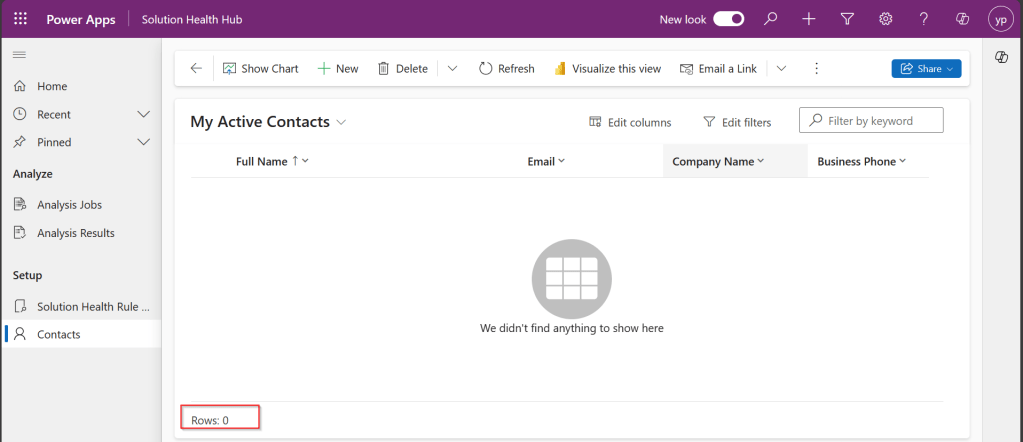
All the records are now deleted.

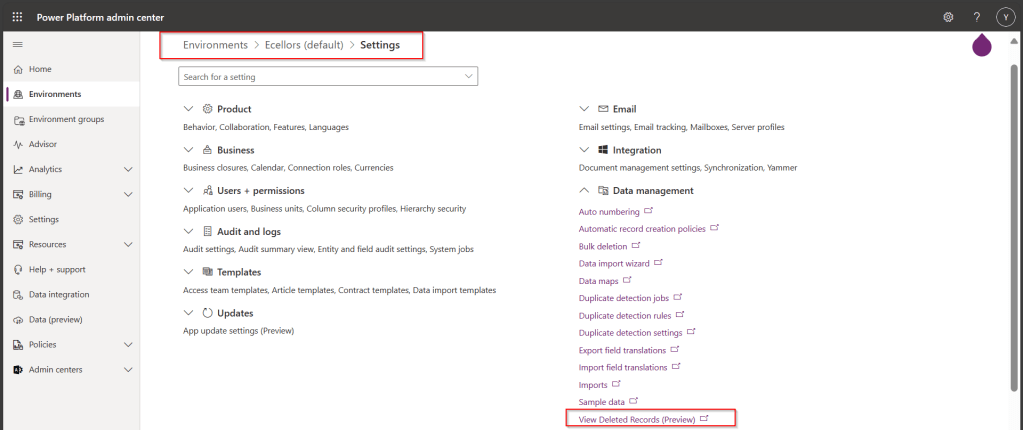
Now, let’s see how to recover them back…. just go to Power Platform Admin Center –> Environments –> Settings –> Data Management

As you click on View Deleted Records, you will be navigated to a view from a new table called DeletedItemReference which stores the deleted records just like recycle bin.

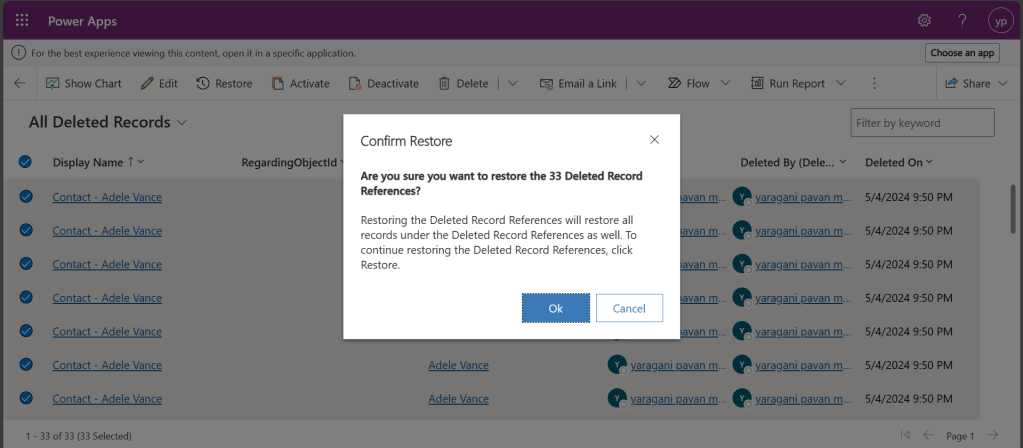
Just select the records, you should see a restore button available on the command bar, here I choose All Deleted Records.

Once you click on restore, you will be shown a confirmation dialog, click on Ok.

You should see the records back in the respective table i.e. Contact here.

In this post, we saw recovering records which were deleted manually…the same thing works for records deleted using Bulk Delete jobs or whatever way you try to delete.

Note:

  1. This is a preview feature and not recommended to use in Production environments right away.
  2. You will not be able to recover the deleted records when you have custom business logic applied to delete the records from deleteditemreference table also, moreover this still a preview feature and not recommended for Production use.
  3. You will be able to recover records which were deleted by the Cascading behavior, like record Child records alone when Parent is still deleted.
  4. You can only recover up to the time frame you have set above and maximum up to 30 days from date of deletion.

Hope you learned something new…that’s it for today…

Reference:

https://learn.microsoft.com/en-us/power-platform/admin/restore-deleted-table-records

Cheers,

PMDY

3 ways for error handling in Power Automate

While everything is being automated, we will learn how effective you can handle the errors while you automate the process. Ideally when a failure happens in a Power Automate cloud flow, the default behavior is to stop processing. You might want to handle errors and roll back earlier steps in case of failure. Here are 3 basic first hand rules to consider implementing without second thought.

Run after

The way that errors are handled is by changing the run after settings in the steps in the flow, as shown in the following image.

Screenshot showing the run after settings.

Parallel branches

When using the run after settings, you can have different actions for success and failure by using parallel branches.

Screenshot showing the parallel branch with run after.

Changesets

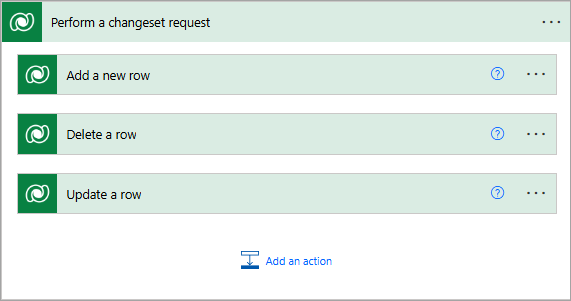
If your flow needs to perform a series of actions on Dataverse data, and you must ensure that all steps work or none of them work, then you should use a changeset.

Screenshot that shows a changeset in flow.

If you define a changeset, the operations will run in a single transaction. If any of the step’s error, the changes that were made by the prior steps will be rolled back.

Special mentions:

  1. Using Scopes – Try, Catch, Finally
  2. Retry policies – Specify how a request should be handled incase failed.
  3. Verify the Power Automate Audit Logs from Microsoft Purview Compliance Portal
  4. Last but not the least – Check the API Limits for the different actions.

Cheers,

PMDY
Connecting to your Dataverse instance to run SQL Queries without using XrmToolBox

Hi Folks,

Do you know that you can connect to your Dataverse DB right from your old toolbox SSMS, an express version would be more than enough to try out. Possibly we didn’t think of, but yes, we can…so let’s see that in this blog post.

Open SSMS..

1.Select Server type as Database Engine

2. Server name as the environment URL from your Power Platform Admin Center as below.

3. So key in those details as below, make sure to Select Authentication method as Azure Active Directory – Universal with MFA option.

Once you click on Connect, you will be prompted for authentication via browser.

Once your Sign-In is successful, you will be able to see.

That’s it, how simple it was connecting to your Dataverse instances…

Having said that it’s easy to connect to Dataverse, not all operations performed using normal transact SQL are supported here using Dataverse SQL. You could see it says Read-Only besides the instance name, that means that you don’t have any capabilities to modify from SQL.

Because Dataverse SQL is a subset of Transact-SQL. If you want to see what statements are supported and what not, just go ahead to this link to find out.

This opens a whole lot of opportunities to explore, so don’t forget to check this out.

References:

Dataverse SQL and Transact SQL

Cheers,

PMDY

Show last refreshed time for your Power BI Reports in Import Mode – Quick Tip

Hi Folks,

If you are working on Power BI, this is a good to know tip.

In case you were using Import mode which is by default suggested by Microsoft for medium or small-scale datasets as it uses Vertipaq engine for improved performance and compression, this post is definitely for you.

Did your user ever asked why they were not able to see latest data in the report. Possibly you could have said it is because of refresh frequency.

Then you could have thought if there was a nice way to show when the dataset was last refreshed. This definitely help your users to have a clear idea of what’s going on.

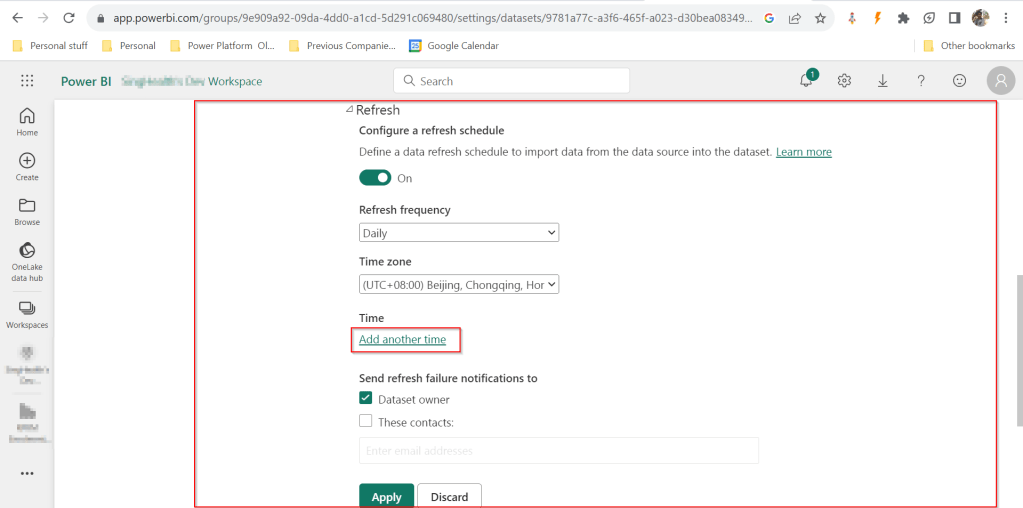
FYI, the refresh frequency could be set in Power BI service as below for import mode.

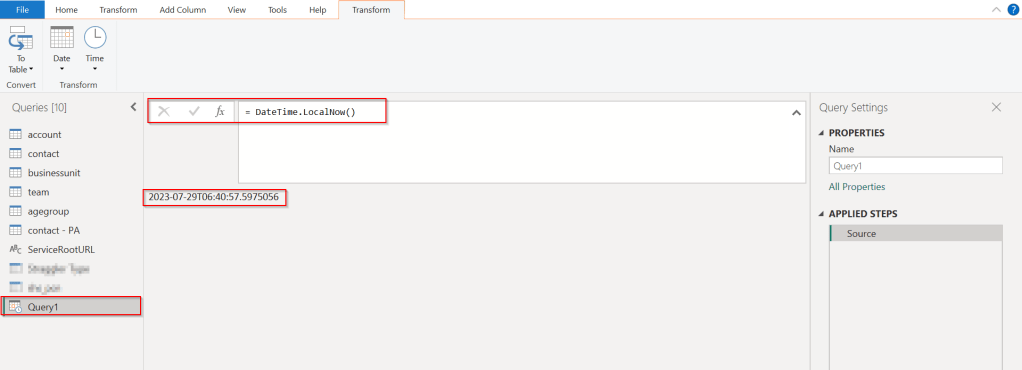
In your Power BI report, click on Transform data.

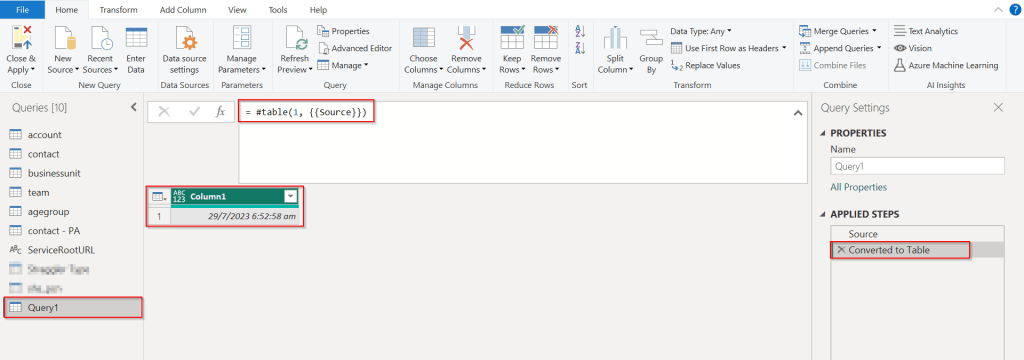
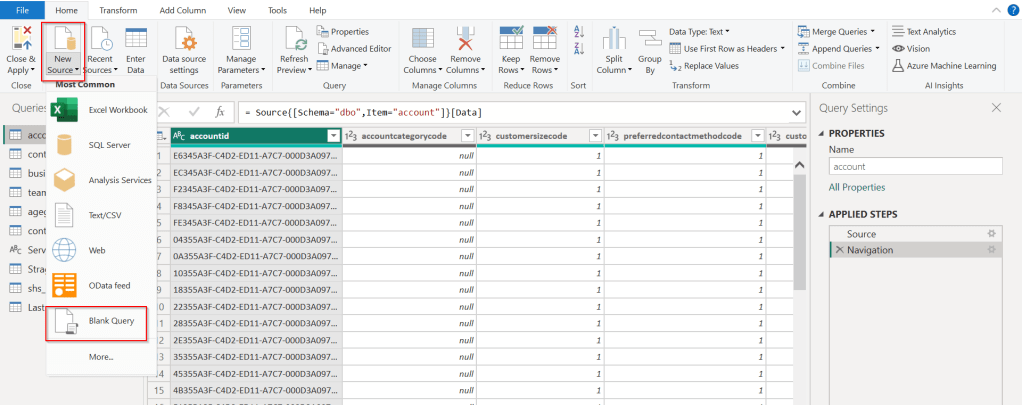
Click on New Source –> Blank Query as below.

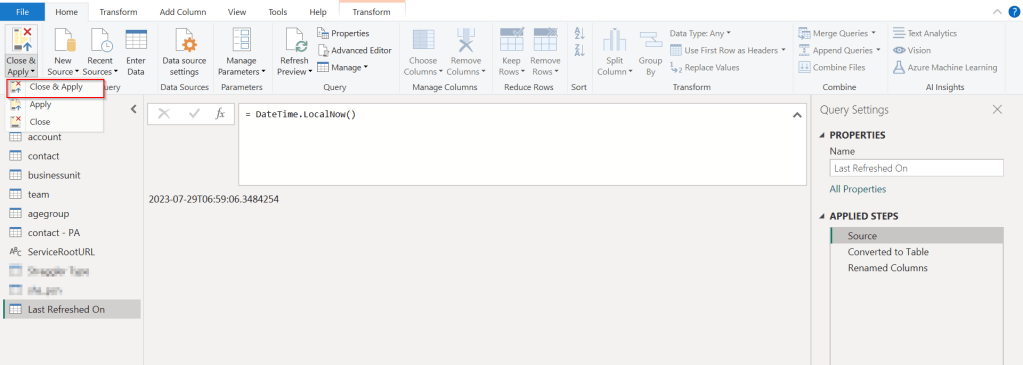
In the Query Fx expression…. enter the below expression to get the last refresh time and click on Tick symbol.

Next, click on To Table to create a table from this data as below.

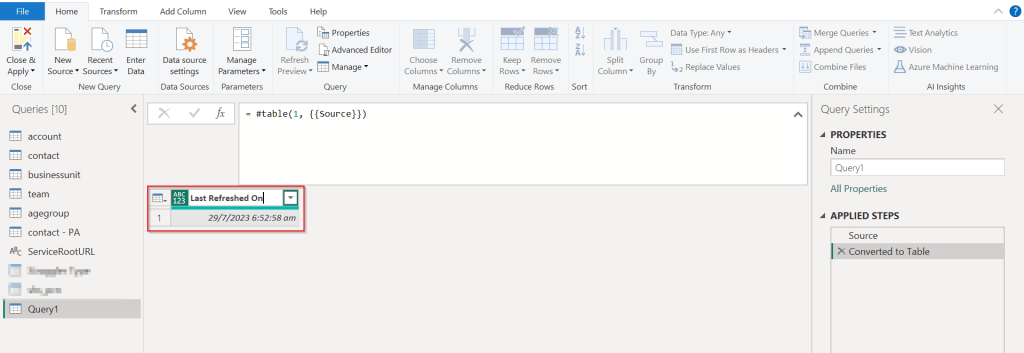
Rename it to something meaningful like below.

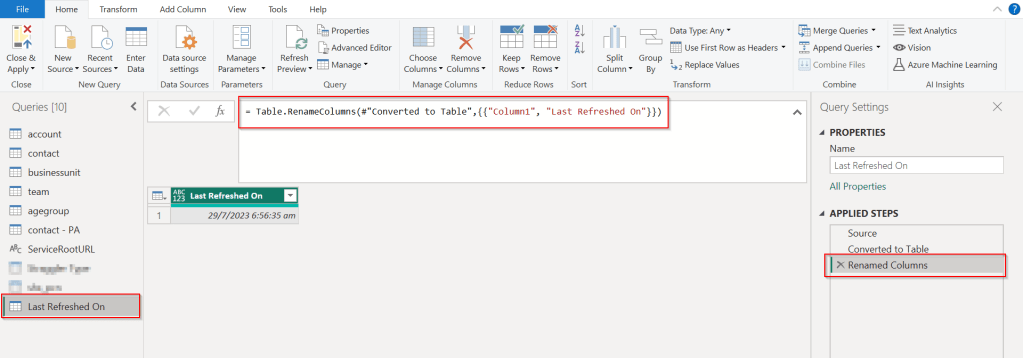
Rename the Query1 variable as below..you should see the applied steps getting added for each operation you performed.

DateTime.LocalNow() gets the last refresh frequency of your dataset in your local time.

Click on Close & Apply

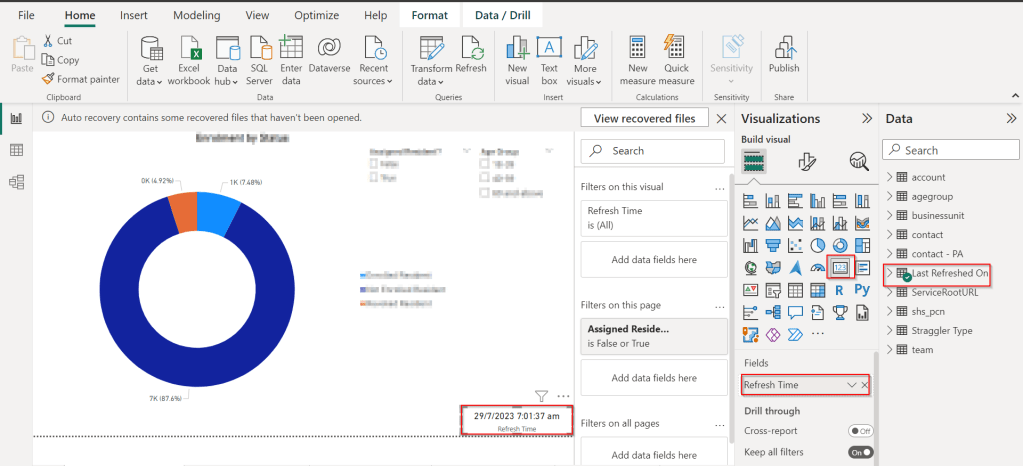
Now in your report, just add a card visual at the bottom right corner and drag the Last Refreshed On query.

That’s it, next time onwards, you should see the date and time when the refresh had occurred.

Cheers,

PMDY
Update your Model Driven App User personal settings in an easier way – Quick Tip

Hi Folks,

Did u ever been asked in your project to update the User Personal Settings….possibly you could have resorted to User Settings Utility in XrmToolBox…may be you could have updated the settings manually for each user in list provided to you…

Do you know you could update them in bulk at one shot in a much easier way, so you don’t need to update it manually one by one. I could see many blog posts talking about updating through this tool, but this was missed in those.

Scenario:

You have newly added users to your Azure Active Directory, now you need to set up the user personal settings for them so see proper time zone in Dynamics.

There were two ways:

  1. Use a view
  2. Choose users from FXB(Fetch XML Builder)

The first approach is easiest of course…

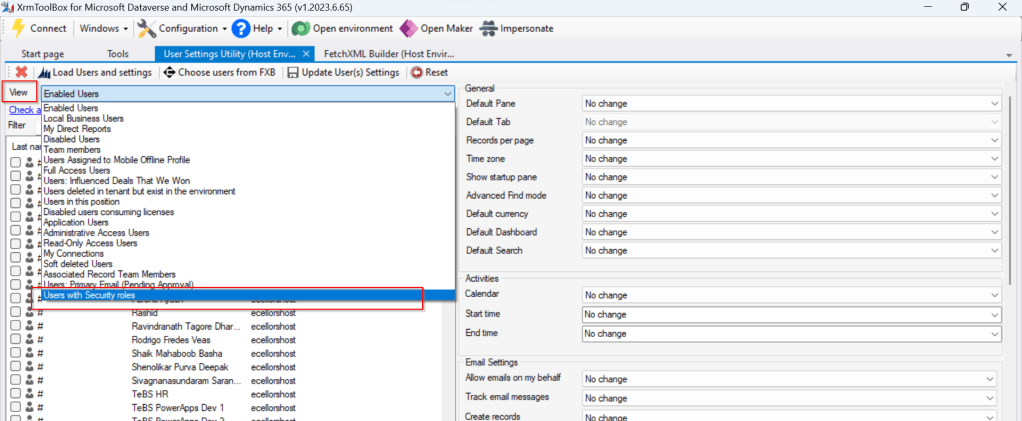
For this, lets create a view Users with Security in user entity as below…you know that you could only update settings for those who were having security role.

Mainly the user need prvReadUserSettings privilege to update the personal settings, the tool doesn’t allow if not.

Once you have connected to the environment, click on Load Users and settings. Now just select the view which have created before…upon selecting the tool will list down all the active users satisfying the view criteria.

All you need is to click on Check all and there by selecting all the users satisfying your filter criteria, change the settings as per your needs on the right-hand side of the tool and click on Update User(s) Settings in one go.

Here I have 3 users in the view, all were updated in one shot…

Isn’t it easy, this trick will save you a lot of time if your user list grows…

Cheers,

PMDY
Changing Data Type of Primary Column now allowed in Model Driven Apps

Hi Folks,

Do you know you can change the Data type of an Primary column between Single Line of Text and Autonumber even after creation of your entity specifying a defined Primary Name Column. There is a catch….

So let’s see…

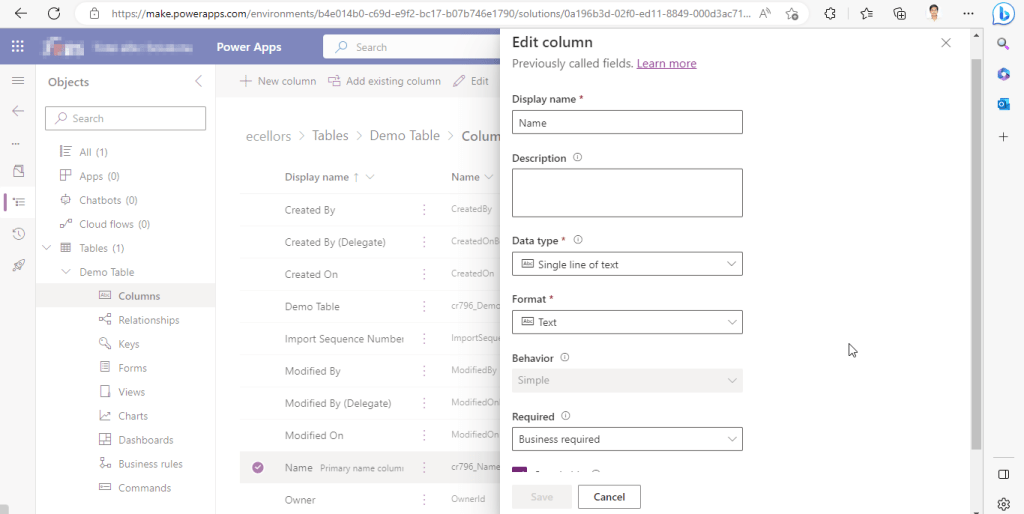
I first created a brand new Table called Demo Table and kept the Primary Column as Single Line of text. Earlier once the table is created, you will not be able to change the Primary name column if you wish to, the only way was to delete the table and re-create it with the correct type. But now you can change the type of the column at least to a unique autonumbering.

I want the Primary Name column to be unique, but when I look at the data in my table captured, I see many duplicates.

So let’s change the data type of the primary column data type to Autonumber.

The primary field look as below initially…

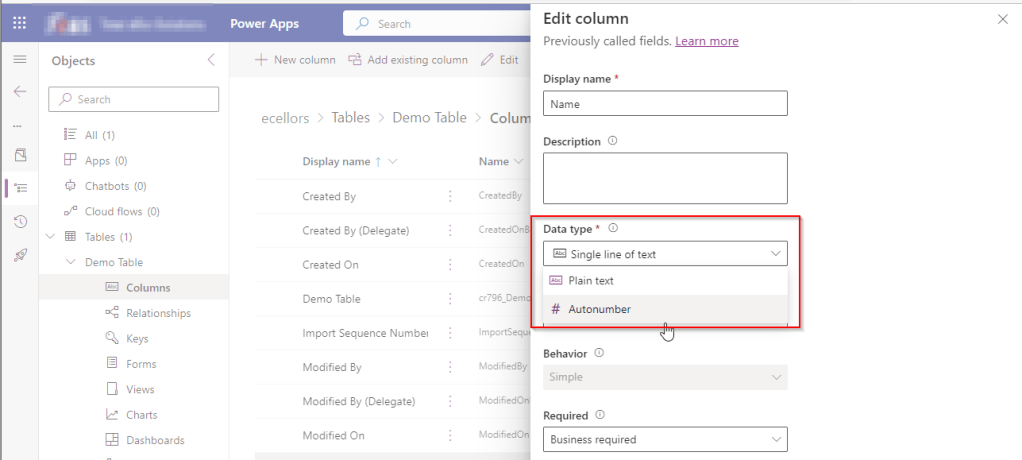
Select the Data Type available…

Now Select the Autonumber from the drop down available…you can optionally specify any custom prefix which you want for your Autonumber…and click Save and publish the customizations.

Now go back to your model driven app and then try creating a new record for the respective entity.

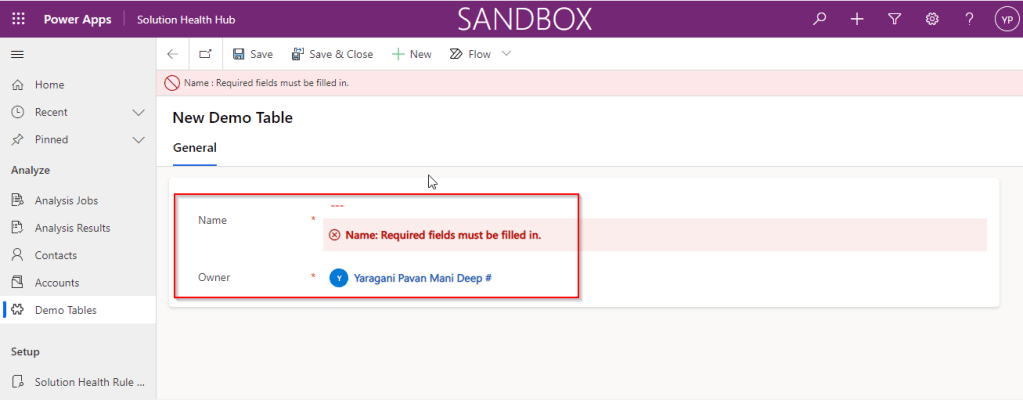
Since it was a primary field column, it is by default made mandatory…what’s up…the Autonumber column data type change is not reflecting….this is the same even if you check and publish the solution multiple times. Neither you can’t specify the field value because you already choose this to be an Autonumber and system should create it by itself.

If you were scratching your head, then this simple tip will help…

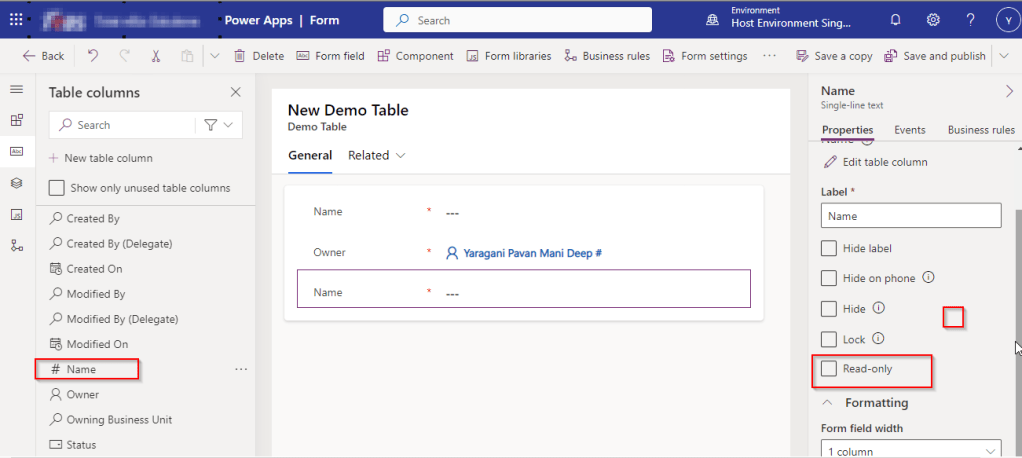
Just make the field read-only from the form where this field is being referred, so you don’t need to really enter value for it…then publish the customizations.

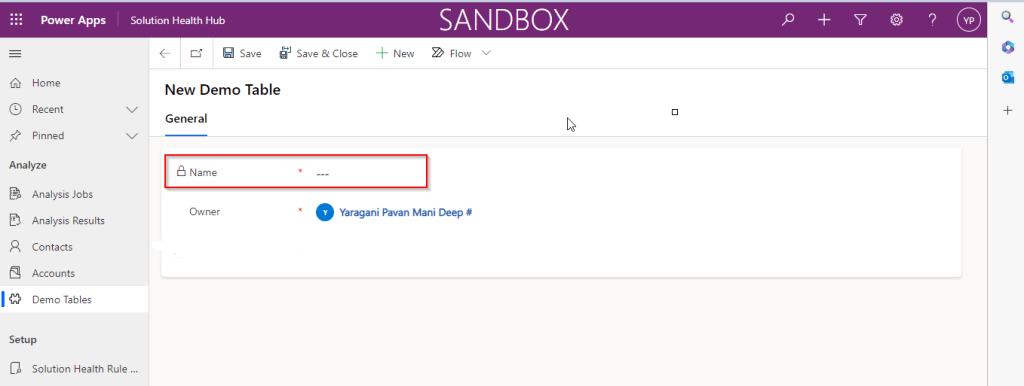
Once you have done…

Now try to save the record..

There you go, you can see an Autonumber being populated in the primary field…

Cheers,

PMDY

Power Platform Requests usage…check it out in a no code way now in Admin Center(Preview)

Hi Folks,

As a Power Platform Admin/Consultant…did you often worry about your Power Platform Request Limits and usage left…? Do you receive warning messages from Microsoft regarding the usage of your database exceeded..? Want to see what are Custom Plugin Errors encountered while using your Model Driven App targeting Dataverse….then want to consolidate them and forward to your team to look into the issues without much efforts….then you were in the right place…

Just login with your credentials to admin page https://admin.powerplatform.microsoft.com/.

Expand Resources to the left…to find the Capacity menu

If you just want to know only the data usage, then you can ahead and click on Download as shown above to get one.

Want to get in depth analysis…then click on Details as highlighted in the same snap above.

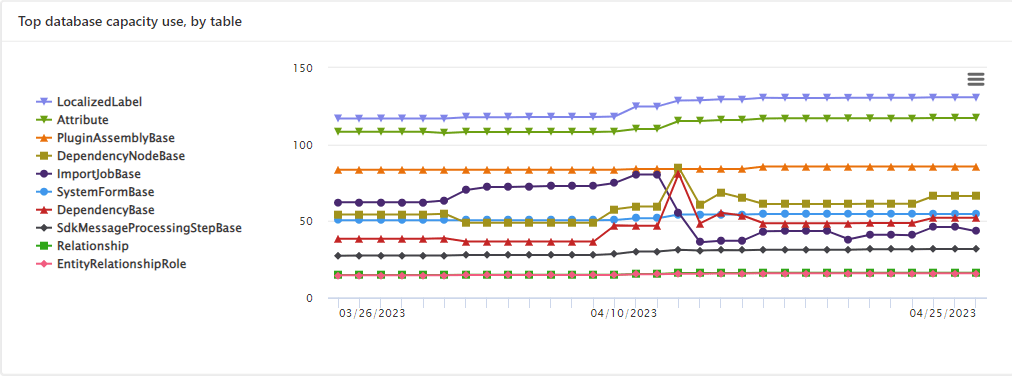
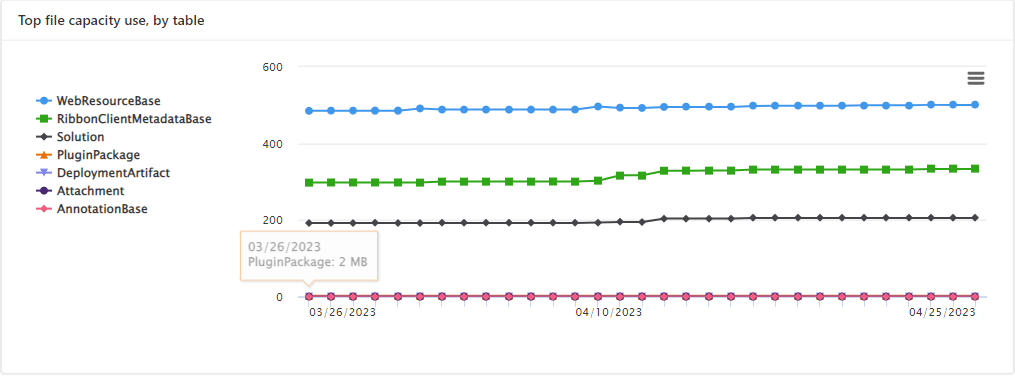
This page shows your Database usage/File usage and respective categorizations by table as below..

These are reports which I was able to extract from my trial environment, however all the reports were not available currently in my region. Yes, this is expected as this feature is still in preview and not recommended for Production Projects as of now. Definitely in the future…

Note:

  1. Many people including me till now thought that Plugins or at least any operation performed within Model Driven app will not be counted for the API request limits. But…
  2. If the requests are making CRUD, assign, or share–type requests, they’ll count except internal requests. For classic workflows, this includes actions such as checking conditions, starting child workflows, or stopping workflows.
  3. You should never use any third party tools for Integration whenever you were facing any request limit issues.
  4. Request limits are applied differently for licensed users and Non-licensed users.
  5. You can add more capacity to any of your products by assigning your environment in the manage addons page.

Hope you found this post helpful…

Cheers,

PMDY