This blog post is all about the latest features released in Power BI Desktop for DAX(Data Analysis Expressions) using DAX Query View.
Do you have the requirement any time to document your DAX functions used in your Power BI Report, then use the DAX query view which introduced new DAX functions to get metadata about your semantic model with the INFO DAX functions.
Firstly, if you were not aware, DAX Query view is the recent addition where we can query the model similar to how the analysts and developers used Power BI Desktop or other 3rd party tools to get the same information earlier. You can access DAX Query view as below in green.
When you navigate to the DAX Query view, key points to note are as below
DAX Queries will be directly saved to your Model when saved from DAX Query View
DAX Query View will not be visible when the Power BI Report is published to the Power BI Service
The results of the DAX will be visible at the bottom of the page as shown below
IntelliSense is provided by default
There were 4 DAX INFO.VIEW Functions introduced as below
List all your Measures using INFO.VIEW.MEASURES() This lists down all the measures in your Semantic Model, it also provides the Expression used for the Measure along with which table it was created.
I have selected the whole results of the measures and Copy the results you see see in the table below
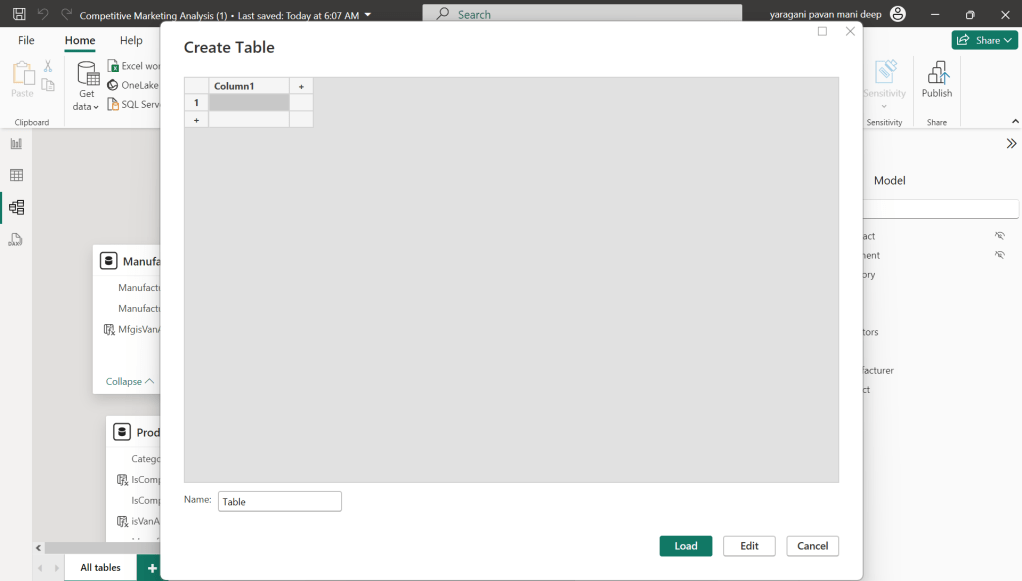
Just go to Model View and click Enter Data
You will be shown a screen like this
Just do a Cntrl + V as you have previously copied the table information
That’s it, how easy it was to document all the Measures, similarly you can document all the Meta Data available for the Power BI Report.
That’s it for today, hope you learned a new feature in Power BI Desktop…
This is the second blog post series on Canvas Apps where you can learn and grow from Zero – Hero in Canvas Power Apps. In this blog post, we will talk about different ways you can get started with creating canvas apps.
Introduction
Power Apps Canvas Apps allow users to build powerful applications with a drag-and-drop interface, requiring little to no coding. Whether you’re a beginner or an experienced user, setting up your first Canvas App is a straightforward process. This guide walks you through each step.
Basic knowledge of what you want to build (e.g., a simple data entry form).
Step 1: Accessing Power Apps Studio
There were different ways you can create a Canvas Apps
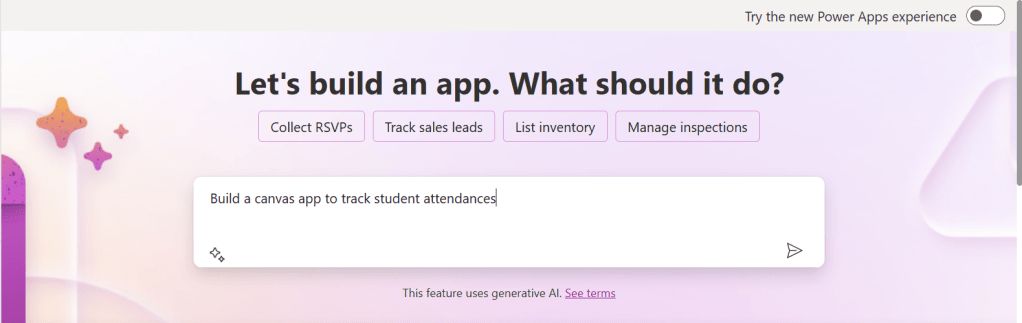
You can create a canvas app by giving your requirement in Copilot which will in turn build your Canvas Apps.
2. You can design them using any of the existing templates available
3. You can also design your App using Plan designer which is the latest feature released and still in preview, for this you need to enable
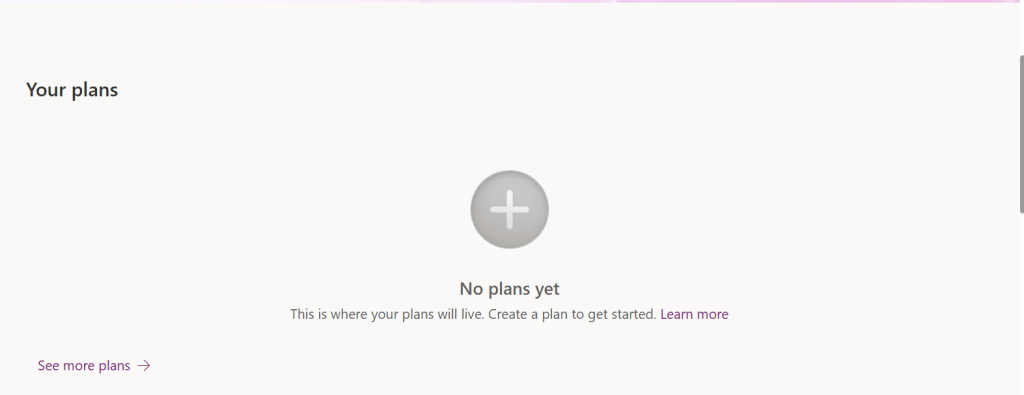
For this you need to have an plan available
You can click on See more plans option available, create new plans if necessary
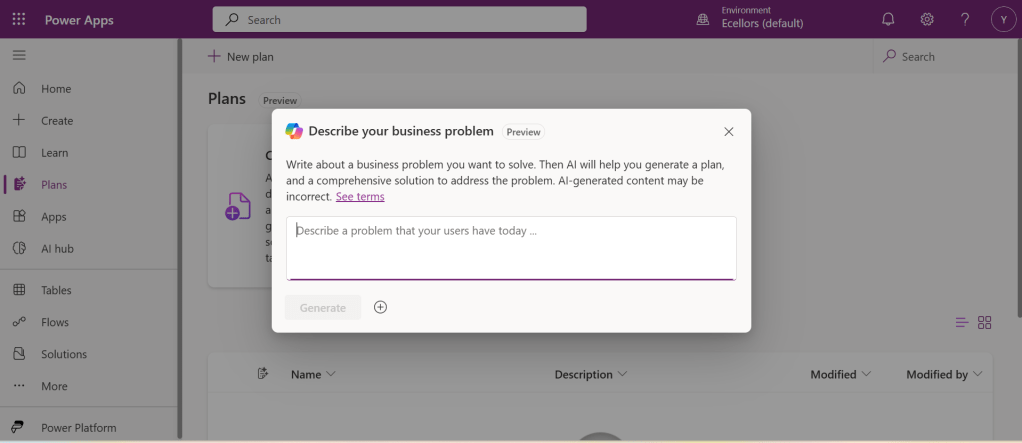
You have to state your business problem, this is pretty much same as using the Copilot in the old experience but here you just tell what problem you have been solving by creating the App, that’s it.
I entered Tracking Student Attendances as my problem and within a matter of 1 min, it designed whole data model where you can accept or propose for a new change.
Once you accept, next it will go ahead and start preparing the data necessary.
After you accept this, it will start designing for the user experiences
Once everything is done, you
It will ask you to save in a solution, this way you will be able to save all your changes to a solution which can be safely moved across environments.
And that’s it, your fully functional app is ready in few mins.
Step 2: Designing Your App
Once inside the Power Apps Studio:
Drag and drop controls from the left-side panel to the canvas.
Add labels, text inputs, buttons, and galleries as needed.
Resize and align elements for a clean layout.
Below is the sample Power App screen in Studio containing the components.
Step 3: Connecting to a Data Source
Click on Data in the left panel.
Select Add data and choose a source like SharePoint, Dataverse, or Excel.
Connect your app to the data source.
Step 4: Adding Functionality with Formulas
Power Apps uses Excel-like formulas to add functionality. Example:
To navigate to another screen: Navigate(Screen2, ScreenTransition.Fade)
To filter data: Filter(Orders, Status="Pending")
Step 5: Previewing and Testing Your App
Click on the Play button in the top-right corner.
Test the app’s functionality.
Fix any layout or data issues as needed.
Image Suggestion: Screenshot showing the app running in preview mode.
Step 6: Saving and Publishing
Click File > Save As.
Choose Cloud as the storage option.
Click Publish to make your app available.
Image Suggestion: Screenshot of the Save & Publish screen.
Conclusion
Congratulations! You’ve built your first Canvas App. You can continue refining it by adding more features, integrating AI, or automating workflows.
Are you ready to explore more? Share your first Canvas App experience in the comments!
Do you want step by step guided walk through, then check this App in a Day Workshop from Microsoft where you can start from scratch and build a fully functional Canvas App.
After a while, I am back with another interesting way to solve this type of problem in Power BI. It took increasingly more amount of time to figure out best approach, this post is to help suggest a way of solving differently. This post is a bit lengthy but I will try to explain it in the best way I can.
Here is the problem, I have date fields from 2 fact tables, I have to filter them using a single date slicer which is connected to a calendar table and show the data when any of dates in a particular row falls in the date slicer range. I initially thought this was an easy one and could be solved by creating a relationship between the two fact tables with calendar table, then slice and dice the data as I was able to filter the data with one fact table when connected to calendar table.
I was unable to do that because there were multiple date fields in one fact table and need to consider dates from two tables. I tried to get the value from the slicer using Calculated field since I have do row by row checking. Later understood that, date slicer values can be obtained using a calculated field but those will not be changing when the dates in date slicer is getting changed, this is because the Calculated fields using row context and will only be updated when data is loaded or user explicitly does the refresh. Instead we have to use measure which is calculated by filter context.
The interesting point here is that, if a measure is added to the visual, it returns same value for each row, so a measure shouldn’t be added to a visual as it calculates values on a table level and not at row level, it is ideal if you want to perform any aggregations.
I tried this approach using the great blog post from legends of Power BI(Marco Russo,Alberto Ferrari), but this looked increasingly complex to my scenario and don’t really need to use this, if you still wish to check this out, below is the link to that.
So, then I tried to calculate the Maximum and Minimum for each row in my fact table using MAXX; MINX functions
MaxxDate =

VAR Date1 = FactTable[Custom Date1]
VAR Date2 = FactTable[Custom Date2]

RETURN
MAXX(
    {
        Date1,
        Date2

    },
    [Value]
)
MinXDate =

VAR Date1 = FactTable[Custom Date1]
VAR Date2 = FactTable[Custom Date2]

RETURN
MAXX(
    {
        Date1,
        Date2

    },
    [Value]
)
After merging the two tables into a single one, then create two slicers connected to Maximum Date and Minimum Date for each row. I thought my problem is solved, but it isn’t, since I was only able to filter the dates which have a maximum or minimum value selected in the date slicer, any date value within the date range is being missed.
This file contains hidden or bidirectional Unicode text that may be interpreted or compiled differently than what appears below. To review, open the file in an editor that reveals hidden Unicode characters.
Learn more about bidirectional Unicode characters
2. Here I didn’t create any relationship between the fact and dimension tables, you can leave them as disconnected as below
3. All you need is a simple measure which calculates if any of the dates in the fact table fall under the slicer date range, here is the piece of code
This file contains hidden or bidirectional Unicode text that may be interpreted or compiled differently than what appears below. To review, open the file in an editor that reveals hidden Unicode characters.
Learn more about bidirectional Unicode characters
In this post, I will be talking about the features of Dataverse Accelerator in brief. Actually, the Microsoft Dataverse accelerator is an application that provides access to select preview features and tooling related to Dataverse development, it is based on Microsoft Power Pages. This is totally different from Dataverse Industry Accelerator.
Dataverse accelerator app is automatically available in all new Microsoft Dataverse environments. If your environment doesn’t already have it, you can install the Dataverse accelerator by going to Power Platform Admin Center –> Environments –> Dynamics 365 Apps –> Install App –> Choose Dataverse Accelerator
You can also refer to my previous blog post on installing it here if you prefer
Once installed, you should see something like below under the Apps
On selection of the Dataverse Accelerator App, you should see something like below, do note that you must have App-level access to the Dataverse accelerator model driven app, such as system customizer or direct access from a security role.
Now let’s quickly see what are features available with Dataverse Accelerator
Reusable, real-time workflows that execute a specific set of commands within Dataverse. Low-code plug-ins run server-side and are triggered by personalized event handlers, defined in Power Fx.
A modern interface to surface the existing plug-in trace log table in Dataverse environments, designed for developing and debugging Dataverse plug-ins and custom APIs. Do you remember viewing Plugin Trace logs from customizations, now you don’t need system administrator role to view trace logs, giving access to this app will do, rest everything remains the same.
A preauthenticated software testing tool which helps to quickly test and play with Dataverse API’s.
I wrote a blog post earlier on using Low Code Plugins, you may check it out here, while using Plugin Monitor is pretty straight forward.
You can find my blog post on using Postman to test Dataverse API’s here.
Now let’s see how can use the API Playground, basically you will be able to test the below from API Playground similar to Postman. All you need to open the API Playground from Dataverse accelerator. You will be preauthenticated while using API Playground.
Instant plug-ins are classified as any user-defined workflows registered as a custom API in the environment with a related Power Fx Expressions.
OData request
Allows more granular control over the request inputs to send OData requests.
Custom API, Instant Plugin – You select the relevant request in the drop down available in API Playground and provide the necessary input parameters if required for your request
OData request – Select OData as your request and provide the plural name of the entity and hit send
After a request is sent, the response is displayed in the lower half of your screen which would be something like below.
I will update this post as these features get released in my region(APAC), because at the time of writing this blog post, this API Playground feature is being rolled out globally and was still in preview.
The Dataverse accelerator isn’t available in GCC or GCC High environments.
Hope learned something about Dataverse Accelerator.
Have you or your user ever mistakenly deleted records in Model Driven Apps..? Do you remember we can recover the deleted records from recycle bin in your PC, now similarly we can also do this in Dataverse also.
In this blog post, I will discuss about how you can retrieve a deleted record in Dataverse.
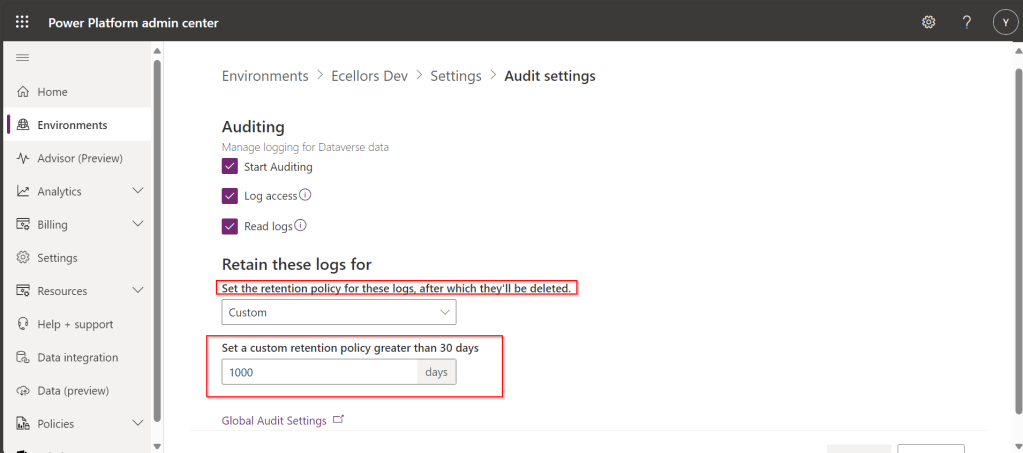
To use this, just enable this feature from Power Platform Admin Center, you can optionally set the recovery interval if you wish to.
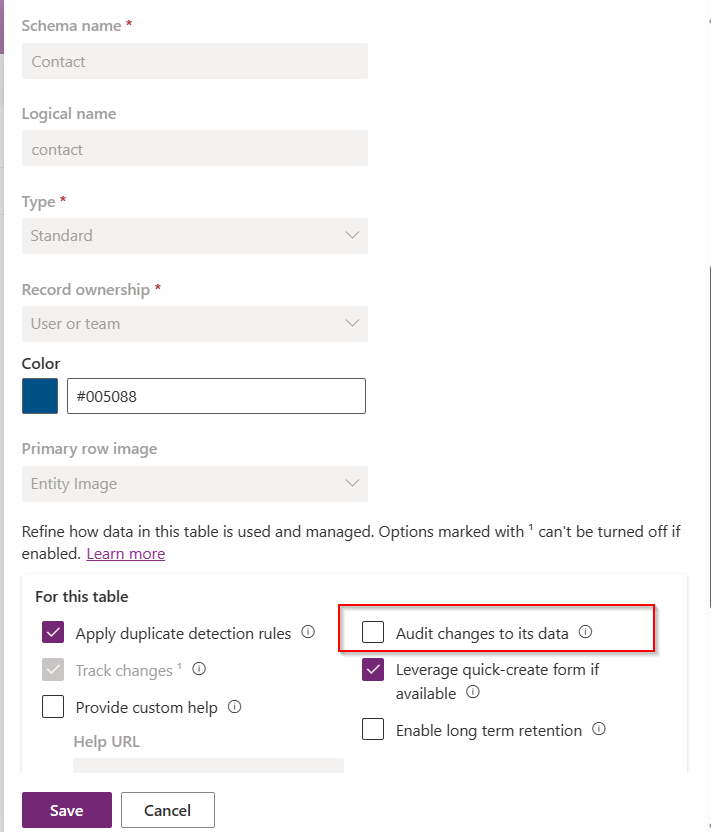
For this, we take Contact table as example, now let’s check the audit setting of the contact table..well, it’s turned off.
Even the auditing is not enabled for the contact entity, with this Recycle Bin Preview feature, we should be able to recover the records, let’s see this in action.
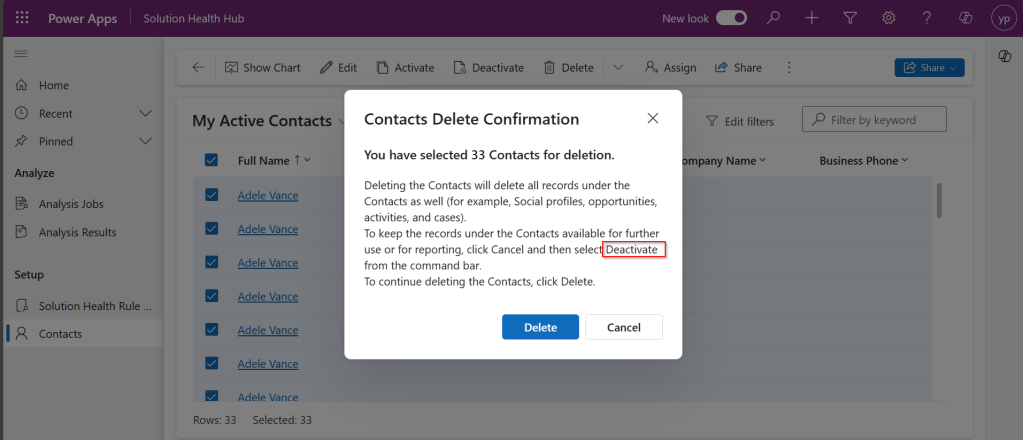
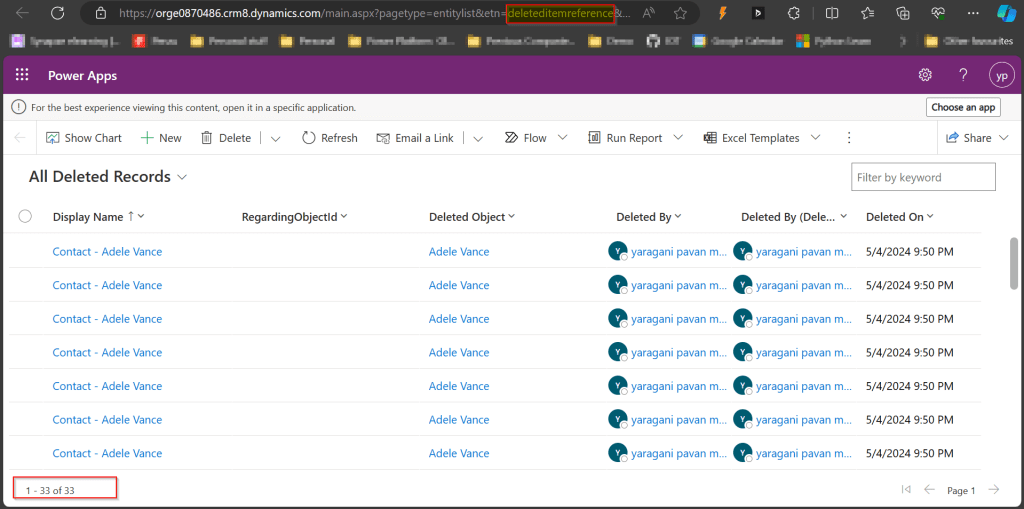
Now try deleting the contact records, I have 33 contact records in my environment, let me delete all of them.
It suggests you deactivate rather than delete, still let’s delete them.
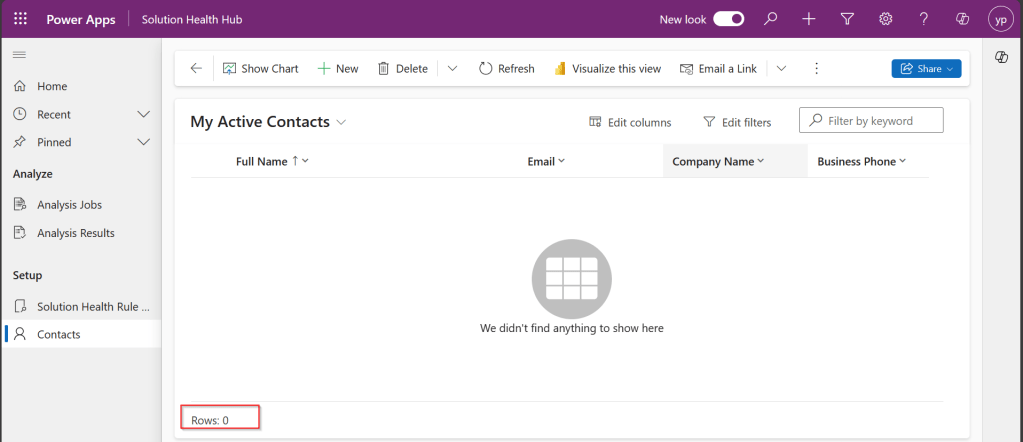
All the records are now deleted.
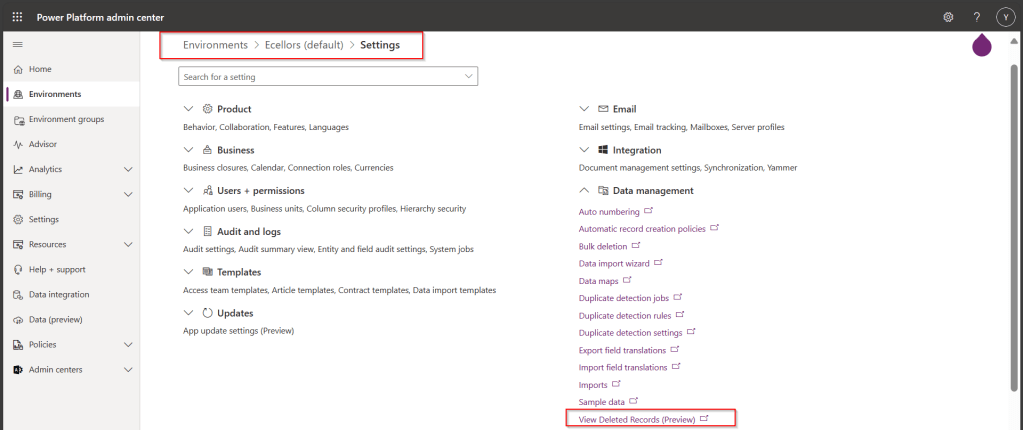
Now, let’s see how to recover them back…. just go to Power Platform Admin Center –> Environments –> Settings –> Data Management
As you click on View Deleted Records, you will be navigated to a view from a new table called DeletedItemReference which stores the deleted records just like recycle bin.
Just select the records, you should see a restore button available on the command bar, here I choose All Deleted Records.
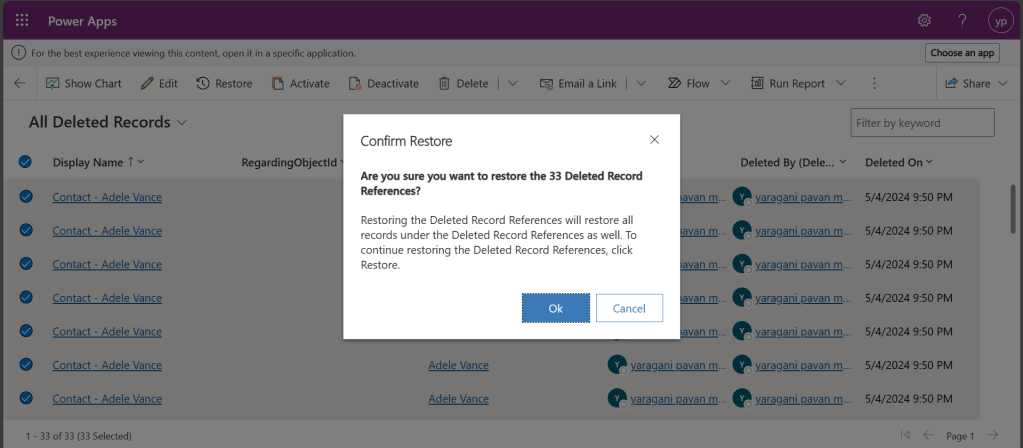
Once you click on restore, you will be shown a confirmation dialog, click on Ok.
You should see the records back in the respective table i.e. Contact here.
In this post, we saw recovering records which were deleted manually…the same thing works for records deleted using Bulk Delete jobs or whatever way you try to delete.
Note:
This is a preview feature and not recommended to use in Production environments right away.
You will not be able to recover the deleted records when you have custom business logic applied to delete the records from deleteditemreference table also, moreover this still a preview feature and not recommended for Production use.
You will be able to recover records which were deleted by the Cascading behavior, like record Child records alone when Parent is still deleted.
You can only recover up to the time frame you have set above and maximum up to 30 days from date of deletion.
Hope you learned something new…that’s it for today…
Do you know that you can set to auto delete the audit log information from Admin center. Yes, you can do this from Power Platform Admin center. Of course, this tip is a very small one, not knowing such feature can cost you so much time to figure out the Audit log deletion.
While everything is being automated, we will learn how effective you can handle the errors while you automate the process. Ideally when a failure happens in a Power Automate cloud flow, the default behavior is to stop processing. You might want to handle errors and roll back earlier steps in case of failure. Here are 3 basic first hand rules to consider implementing without second thought.
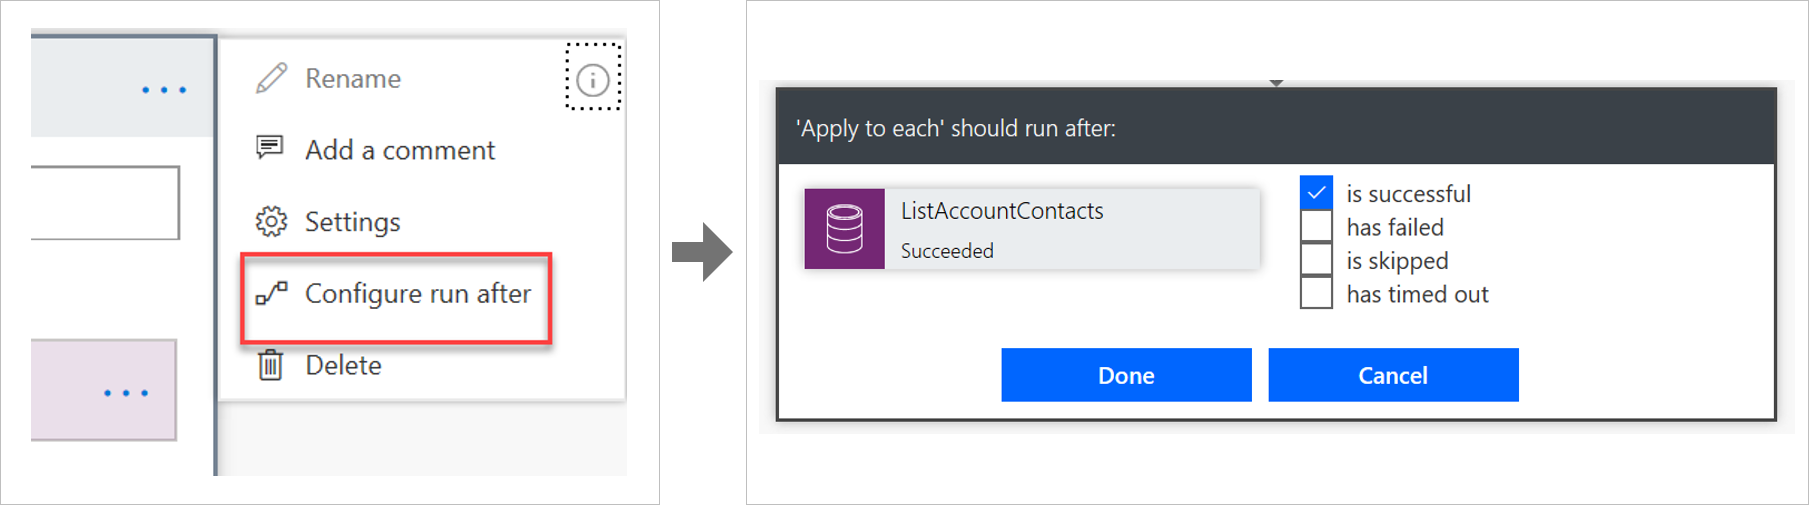
Run after
The way that errors are handled is by changing the run after settings in the steps in the flow, as shown in the following image.
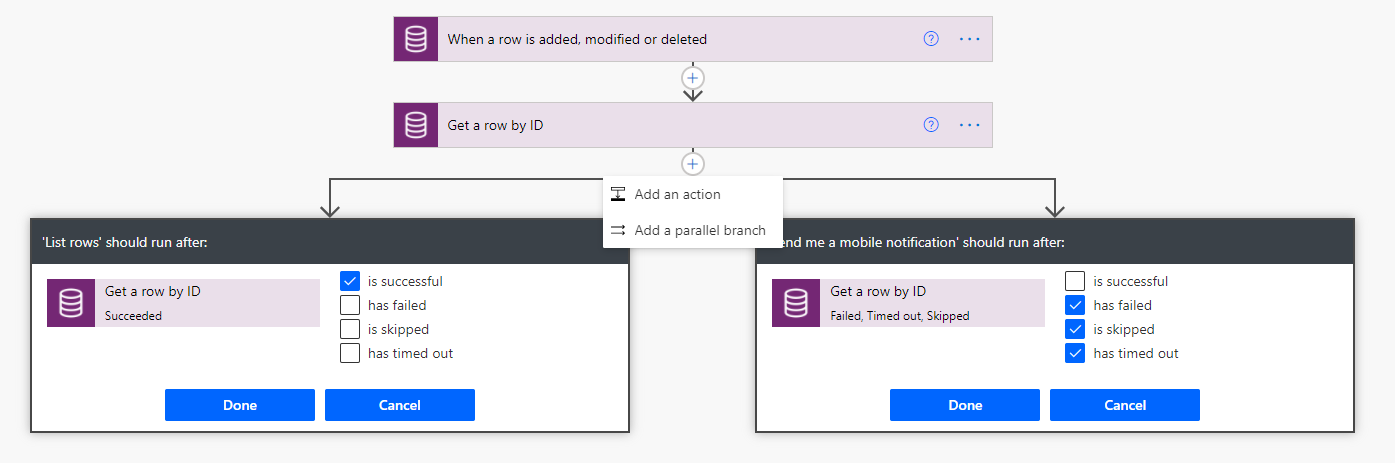
Parallel branches
When using the run after settings, you can have different actions for success and failure by using parallel branches.
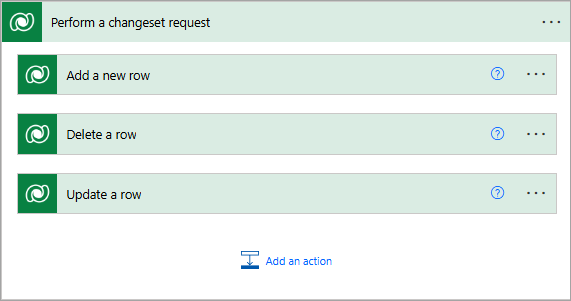
Changesets
If your flow needs to perform a series of actions on Dataverse data, and you must ensure that all steps work or none of them work, then you should use a changeset.
If you define a changeset, the operations will run in a single transaction. If any of the step’s error, the changes that were made by the prior steps will be rolled back.
Special mentions:
Using Scopes – Try, Catch, Finally
Retry policies – Specify how a request should be handled incase failed.
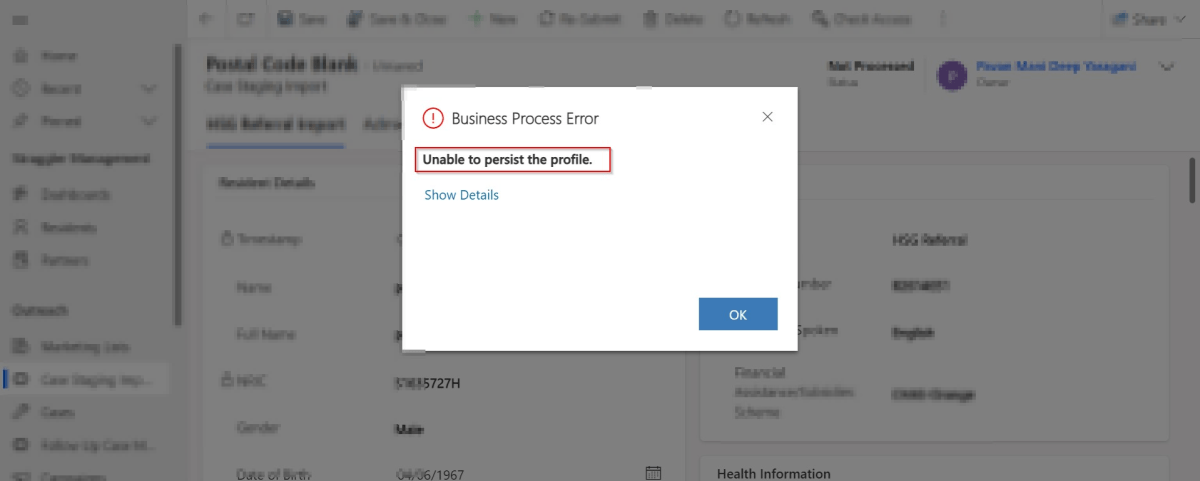
Are you debugging the Dynamics 365 Plugins using Plugin Profiler, did you ever notice this problem that you were unable to persist profile so as to debug your plugin. Did you got frustrated as you couldn’t capture the profile even after lot of tries installing and uninstalling the profiler. Just read on. I am writing this blog post after fixing a similar situation with one of my Plugin.
First of all, I would advise you to check the below.
Plugin trace log under Settings –> Plugin Trace Log.
Check if your Plugin is being called multiple number of times
Check the filtering attributes of your Plugin whether it is causing to go in an infinite loop
Suppose if you have added an image, did you select the respective attributes of the image
Did you add sufficient depth conditions to prevent infinite loop executions.
At what step is your plugin running, is it in PreOperation, PostOperation.? In case you were throwing an error, change it to Prevalidation step and check.
Were you using persist to entity option while debugging, try changing to throw an error and see.
If you note that the system becomes unresponsive and you were not able to download the log file, then definitely your logic is getting called multiple times. Please reverify.
Once you have verified these, you should be able to find out the exact root cause of the issue…I will leave to yourself.
Thank you for visiting my blog today, this post is all about improving the performance of SSIS Data Flow Task which I would like to share with everyone.
Do you know, you can improve your SSIS Data Flow Task easily just by setting AutoAdjustBufferSize Property of your data flow task. If you already know this, you can skip further reading.
I already placed Balanced Data Distributors in my SSIS job, but the performance of Kingswaysoft CDS/CRM Component is not promising and too low.