If you are working on Power BI, this is a good to know tip.
In case you were using Import mode which is by default suggested by Microsoft for medium or small-scale datasets as it uses Vertipaq engine for improved performance and compression, this post is definitely for you.
Did your user ever asked why they were not able to see latest data in the report. Possibly you could have said it is because of refresh frequency.
Then you could have thought if there was a nice way to show when the dataset was last refreshed. This definitely help your users to have a clear idea of what’s going on.
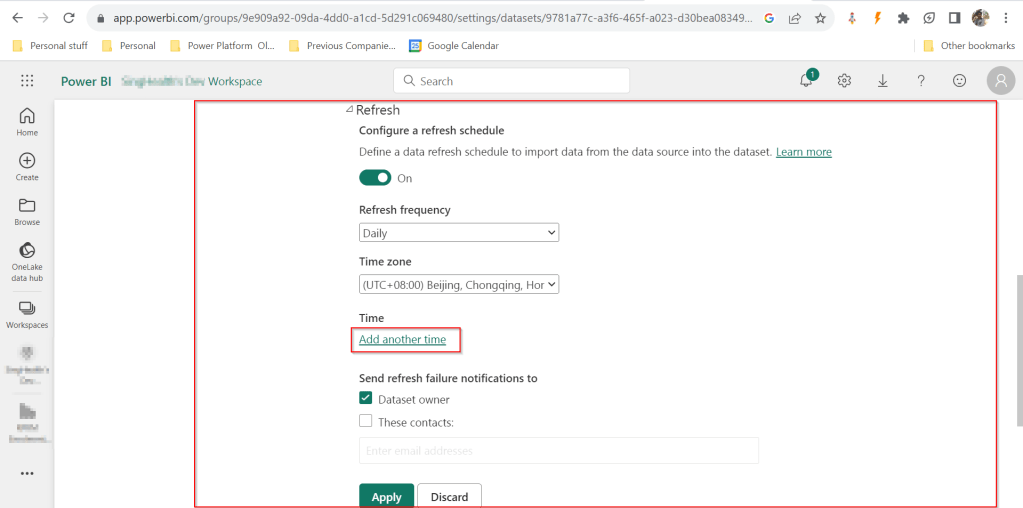
FYI, the refresh frequency could be set in Power BI service as below for import mode.
In your Power BI report, click on Transform data.
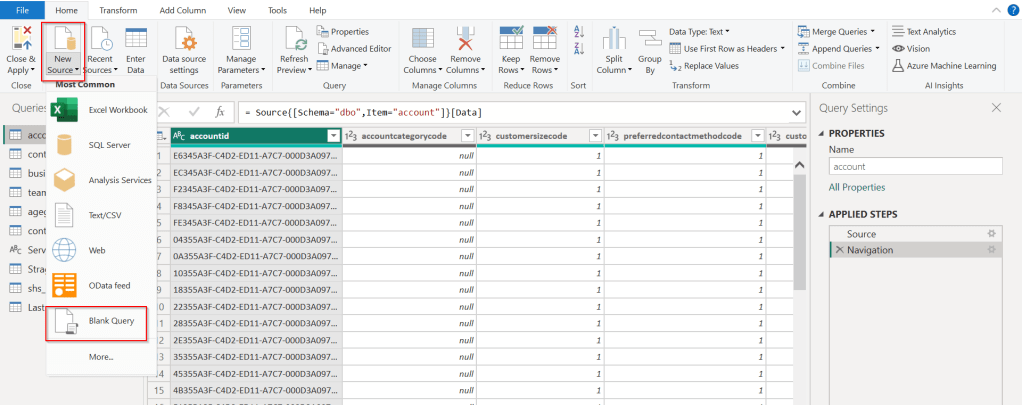
Click on New Source –> Blank Query as below.
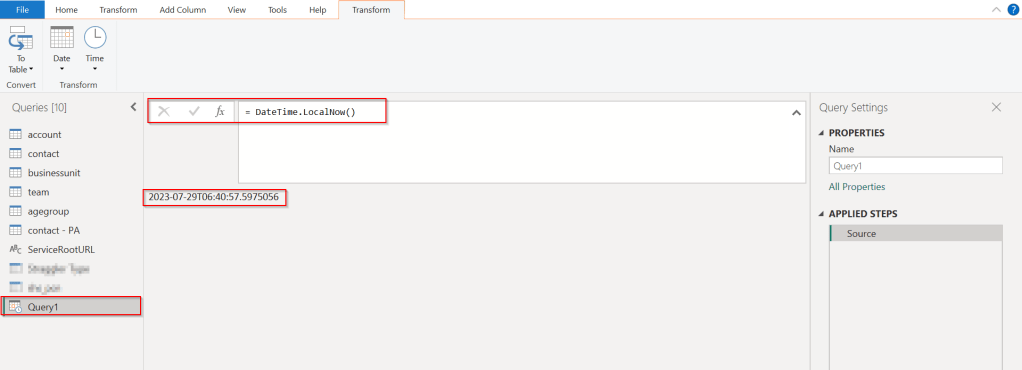
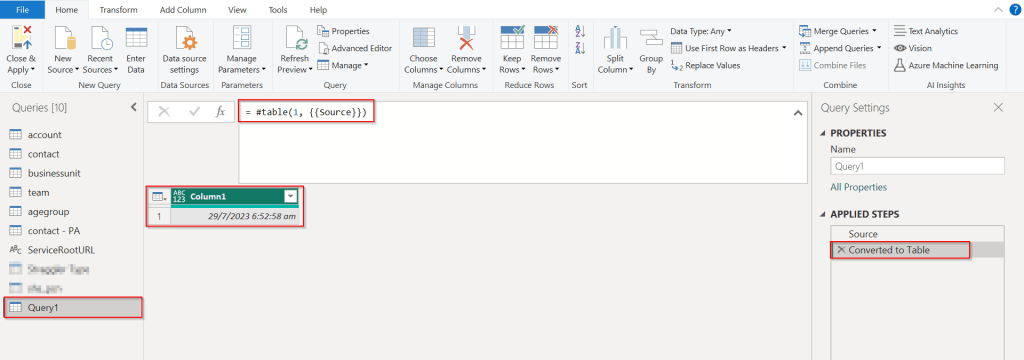
In the Query Fx expression…. enter the below expression to get the last refresh time and click on Tick symbol.
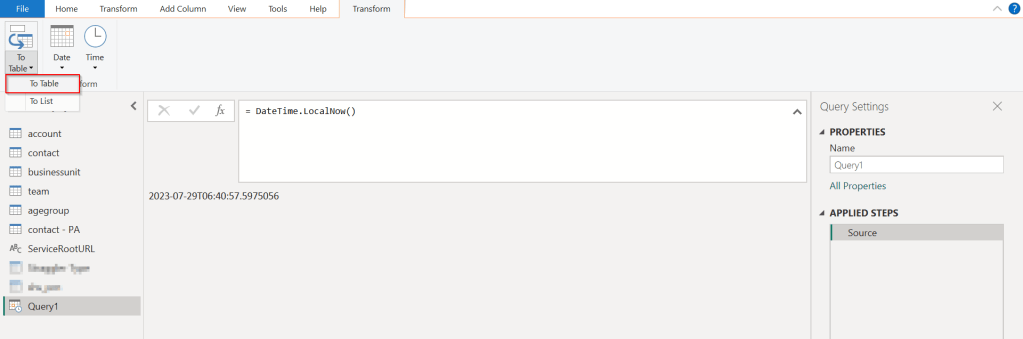
Next, click on To Table to create a table from this data as below.
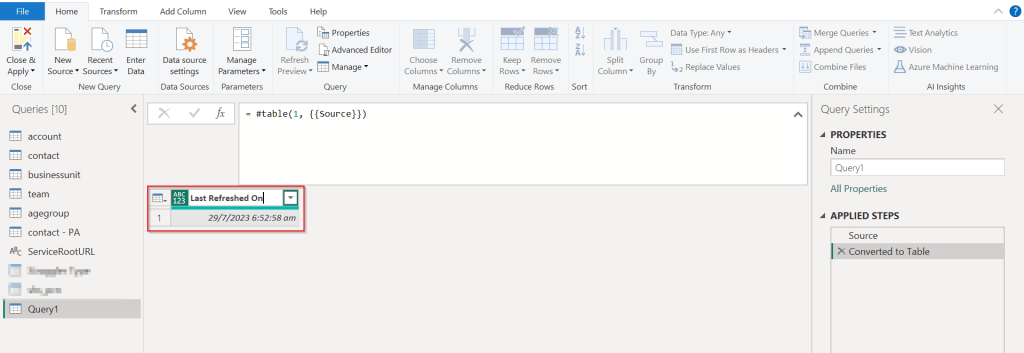
Rename it to something meaningful like below.
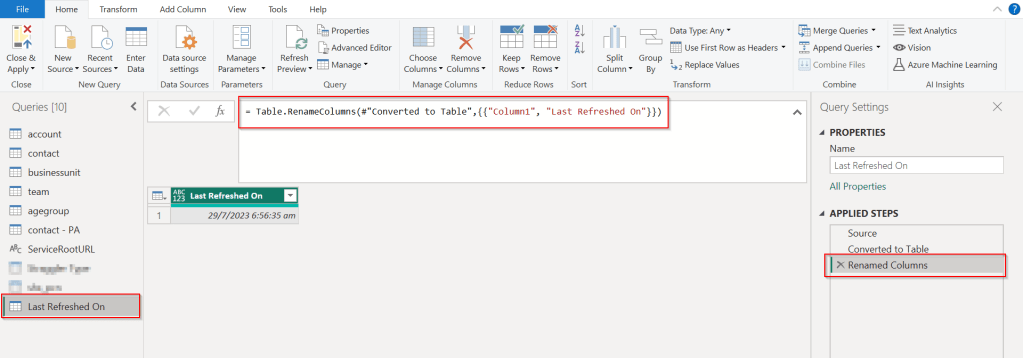
Rename the Query1 variable as below..you should see the applied steps getting added for each operation you performed.
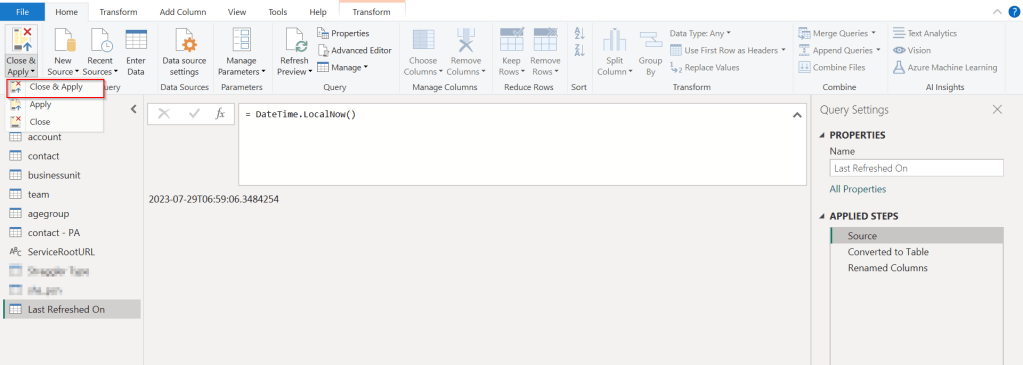
DateTime.LocalNow() gets the last refresh frequency of your dataset in your local time.
Click on Close & Apply…
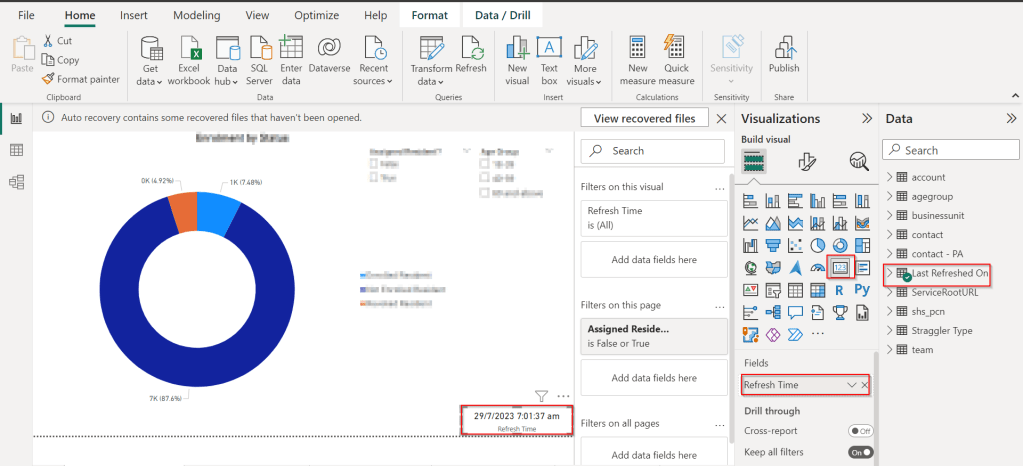
Now in your report, just add a card visual at the bottom right corner and drag the Last Refreshed On query.
That’s it, next time onwards, you should see the date and time when the refresh had occurred.
In this blog post, let’s see how we can create a custom connector without leaving our own Visual Studio for building a custom connector. Ideally for building any custom connector, we need to create them in https://make.powerapps.com or https://make.powerautomate.com. Last month Microsoft Announced that Power Platform is now a connected service in Visual Studio 2022. In this blog, we will utilize its capability…
Before diving deeper, let’s see what are the prerequisites..
Visual Studio
ASP .NET Web API knowledge
Canvas Apps knowledge
Let’s get started..
Step 1:
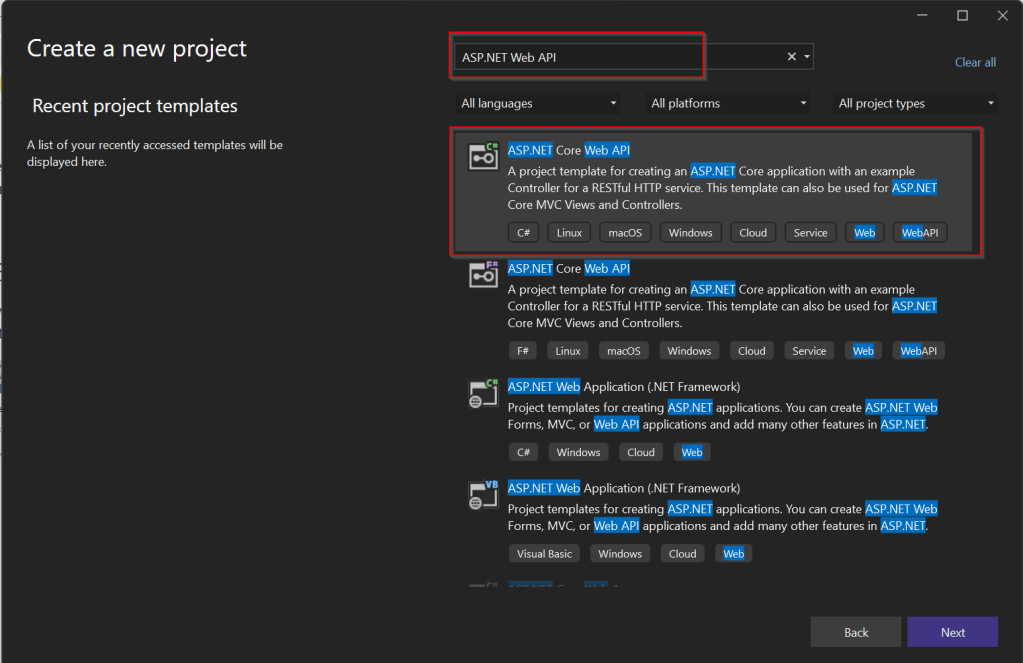
Create ASP.NET Web API Project in Visual Studio
Step 2:Choose your option as below and click on Next..
Step 3:
Choose your next steps as below and click on Next to proceed, make sure to choose authentication type as None
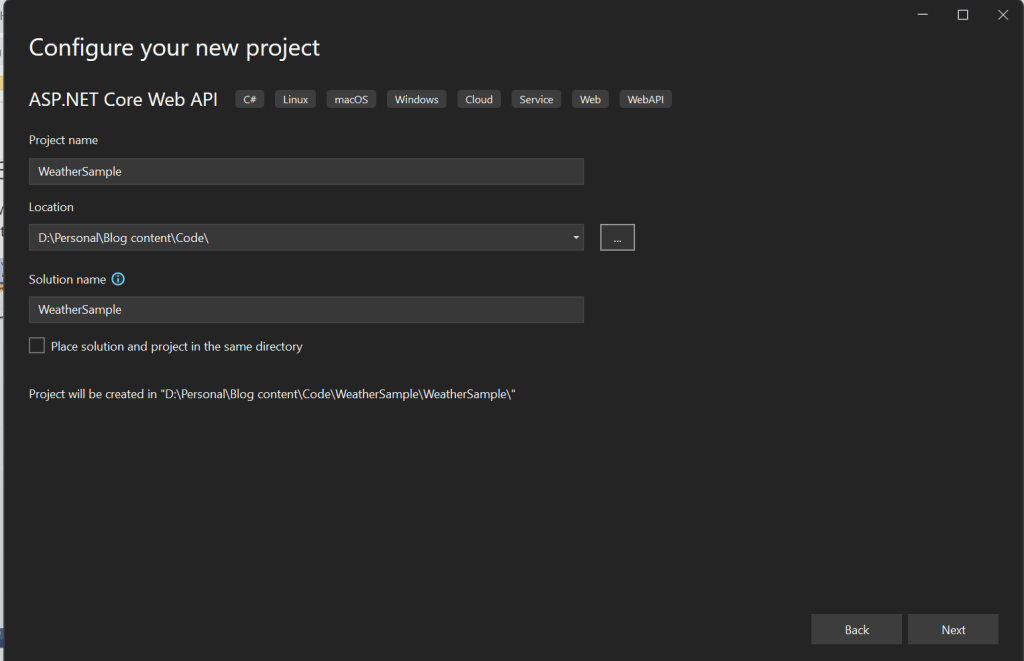
Step 4:
Create a ASP.NET Core Web API Project
Step 5:
By adding Power Platform as a service dependency, you can update an existing custom connector, or create a new one from your API.
If you want to expose your local running API to a public endpoint, I prefer using Dev Tunnels feature of Visual Studio…
That’s it, you have started running your API.
Step 6:
Now let’s create a Mobile App with Power Apps…with the same login you have used for the Visual Studio to create a custom connector..
Step 7:
First check if Custom Connector has been created in your tenant and authenticate the connection….navigate to https://make.powerapps.com and click on Discover at the left of the page….and then click on Custom Connectors, you should see a connector which we created from Visual Studio….nice isn’t it…
Step 8:
All you need to create a connection by clicking on the + sign available..
Once connected, now try creating a mobile Canvas App..
In the Canvas App, try adding data…and search for Weather Sample which you created, you should see something like below…
Step 9:
Once the web API is running in your development environment, you can debug in real time and even Hot Reload your code.
Prerequisite: Intall Dataverse Accelerator from AppSource from Microsoft Power CAT Team. Follow along once you have installed…see Dataverse Accelerator Installation Post if you want to know how..
Firstly, open the environment from https://make.powerapps.com where you would like to test this out, install the Dataverse Accelerator Solution as described above.
You should see there is an option to create Plugin from UI itself, no need to open Visual Studio and write your .Net Class library and register using Plugin Registration tool.
Please note that this is still an Experimental Feature and lot of improvements yet to be made..below is my quick test on basic CRUD Operation using this Plugin..
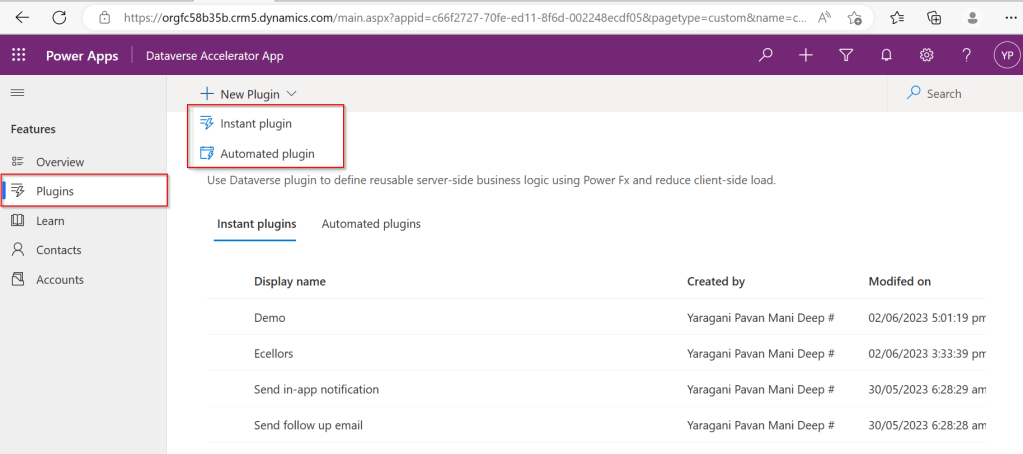
There were two types of Low Code Plugins
Instant Plugins
Automated Plugins
Let’s see how they work by creating an Instant Plugin…
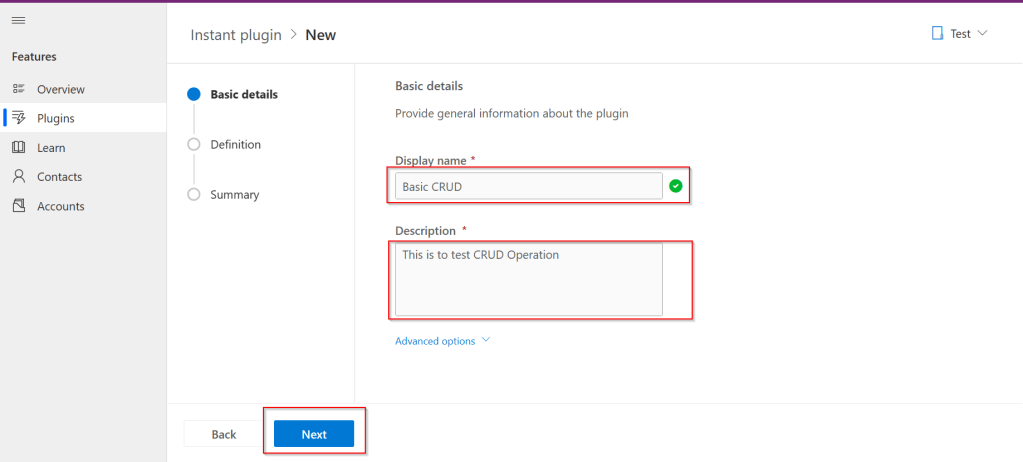
Step 1: Click on New Plugin Button available
Step 2: Key in the display name and description, both are mandatory to be entered…we don’t have a way to customize here as of now…
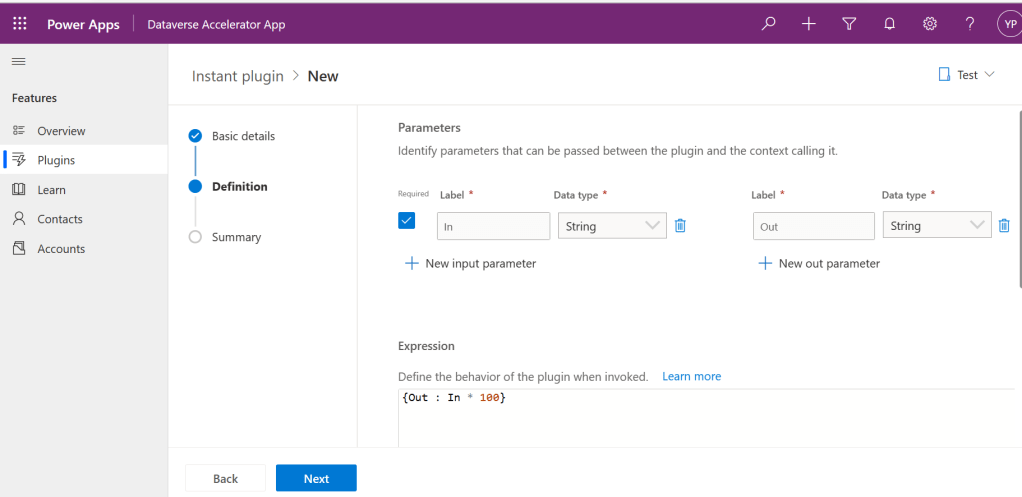
Step 3:Then Click on Next and enter the Parameters in the Definition area…I just mentioned In and Out parameters for brevity, then added a simple expression to multiply the input variable supplied by 100…
Make sure you won’t get any errors
Step 4: Then click on Next and click on Save.
Step 5:Once Saved, you will get a new button for testing…
Step 6:Clicking on Test will get you to the below screen to enter your input parameter…
Step 7:Clicking on Run which gives the output in Web API and highlighted is the response received with a success.
Note:
For some of the Automated Plugins, got a failure message with no way to troubleshoot what was the error was…I have raised this to Microsoft, but they mentioned that these features are work in Progress…
Hope we get all the complex functionality there in Dynamics 365 CE Plugins be available within Dataverse Low Code Plugins with the help of Power Fx too in future….the App development is going to be lot more easier…with Microsoft Power Platform… and citizen developers can pitch in…
Yesterday I was working with Azure DevOps repository for my project. My local Develop branch is behind the Main branch by few commits, I want to get the latest commits into my local and include those from the Main branch also in to my Develop branch.
It is then I got to know whether to use GIT Merge Command or GIT Rebase Command. And here you go my findings on the same….
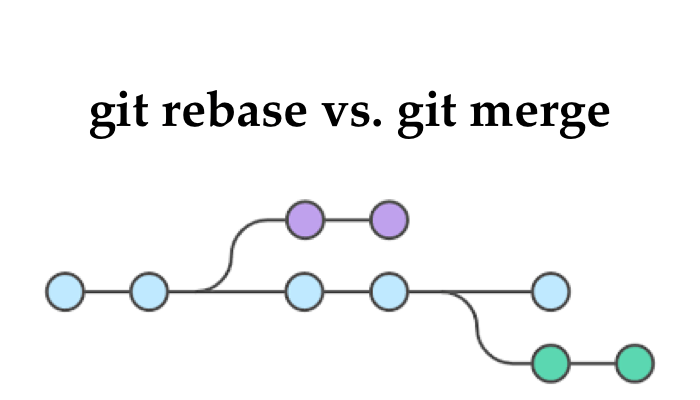
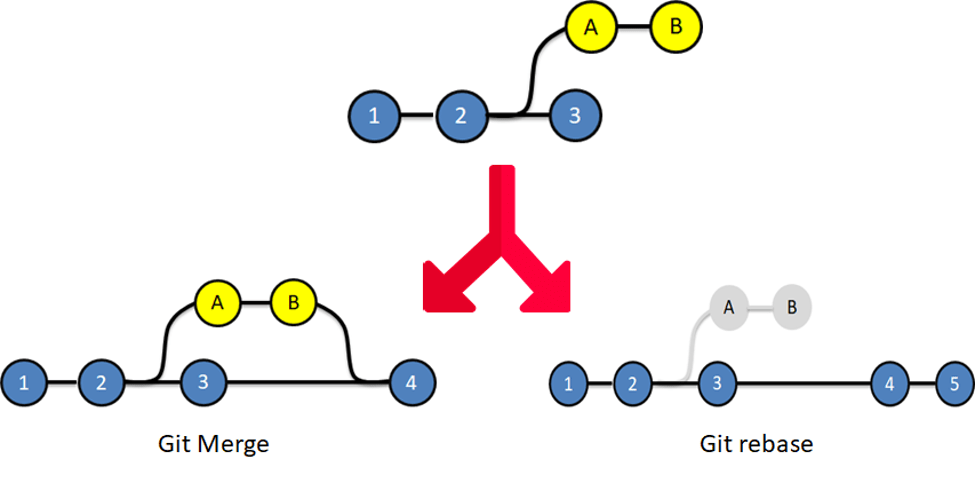
I got to know the details, official Git manual states that rebase “reapplies commits on top of another base branch”, whereas merge “joins two or more development histories together”. In other words, the key difference between merge and rebase is that while merge preserves history as it happened, rebase rewrites it. Let’s start with an illustration…for better understanding…followed by the differences…
Merge
Rebase
Git merge is a command that allows you to merge branches from Git.
Git rebase is a command that allows developers to integrate changes from one branch to another.
In Git Merge logs will be showing the complete history of the merging of commits.
Logs are linear in Git rebase as the commits are rebased
All the commits on the feature branch will be combined as a single commit in the master branch.
All the commits will be rebased and the same number of commits will be added to the master branch.
Git Merge is used when the target branch is shared branch
Git Rebase should be used when the target branch is private branch
Actually talking both do mean the same purpose and have their own uses, but at the end of the day it is completely up to your ALM strategy/methodology. I preferred to use Merge instead of Rebase just that my branch is shared branch and for simplicity.
In this blog post, I will talk about implementing a custom page for your implementations.
Here in our use case, customer want to see a pop up dialog box where they can reject the cases from a button and when reject is clicked, there should be a dialog box to capture the reject reason and comments and update them back to the record. So for this we had to implement a custom page and called from a Ribbon button. If you just want to show an alert, you can very easily implement using JavaScript with the help of OOB Alert Dialog…
But in case as user want to update entity details like optionset field, directly from the pop up, you should consider using the approach as we did using a custom page.
.
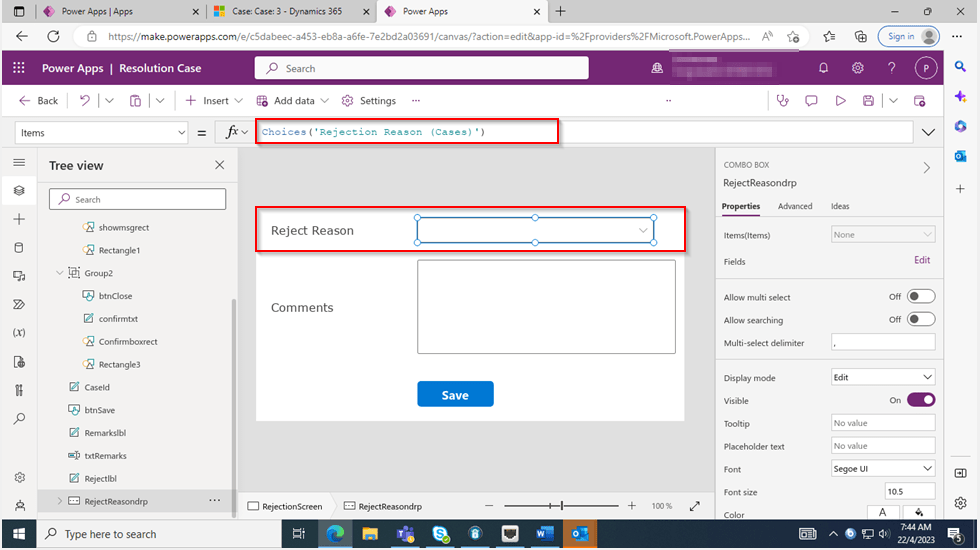
All we have used is JavaScript, Ribbon Workbench and Custom Page…First is to design the custom page in https://make.powerapps.com/
The optionset for Reject Reason is bound to the Reject Reason combo box using the below property.
On the App start, we will set the parameter with what we have supplied from the ribbon on-click function.
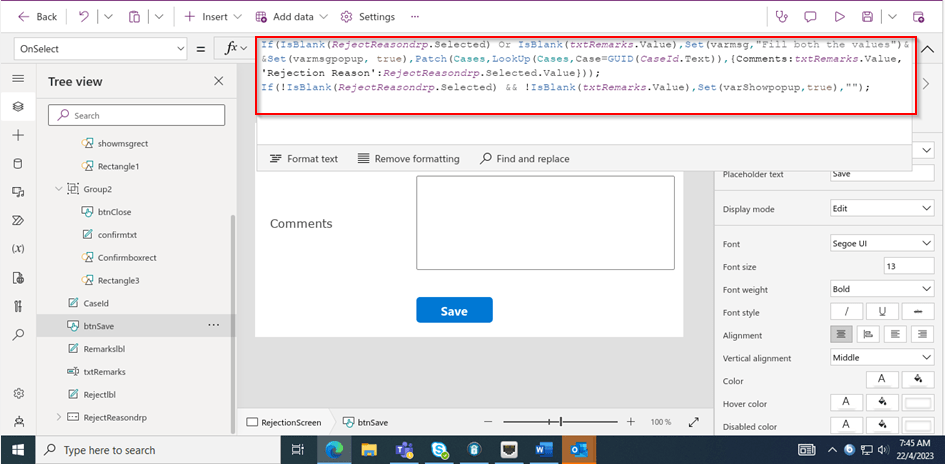
On the OnSelect property of the Save button, we can use the below function
Function:
This file contains hidden or bidirectional Unicode text that may be interpreted or compiled differently than what appears below. To review, open the file in an editor that reveals hidden Unicode characters.
Learn more about bidirectional Unicode characters
This file contains hidden or bidirectional Unicode text that may be interpreted or compiled differently than what appears below. To review, open the file in an editor that reveals hidden Unicode characters.
Learn more about bidirectional Unicode characters
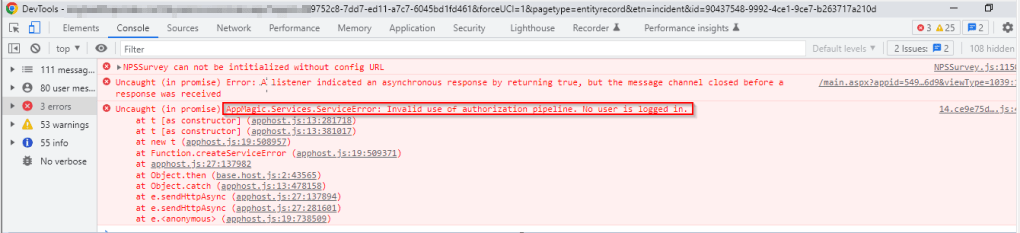
Finally publish the customizations and add the custom page to the model driven app…don’t forget to add this to your app as this mandatory to get the authorization to your page as below, else you see below error in developer tools of your browser as below…and no custom page opens up…
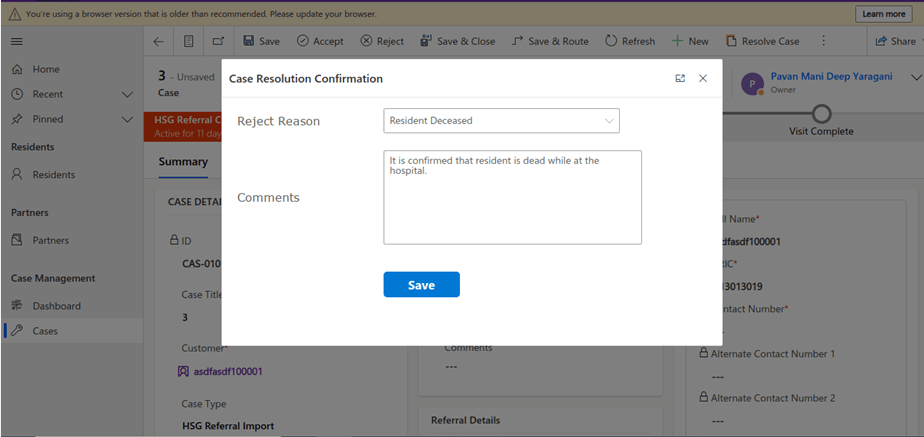
That’s it…when a Reject is clicked, you should a see a page as below..
Upon entering the details as above, you will be shown a confirmation screen as below..
Once you click on Close, the selected details will be updated back in the record.
Hope this helps someone implementing custom page for a similar requirement….
This blog is just to let you know why you should stop implementing OData calls using V2.0 version. I am pretty sure almost every Dynamics CE project out there have used this OData calls definitely in their implementations from quite some time. While some of new implementations have replaced the logic using Web API, still some people go with using OData V2.0 calls to build their functionality using JavaScript.
Microsoft had actually planned to remove this endpoint from April 30, 2023. But they deferred this because many projects are’nt yet prepared for removal of this end point and help the customers prepare for this transition to Web API end point.
Identify if you still using OData V2.0 end point, actually Organization Data Service is an OData V2.0 endpoint which was introduced with Dynamics CRM 2011..it’s deprecated way back with Dynamics 365 CE version 8.0.
So now, how to identify where and all you were using OData End Points in your code…you shouldn’t expect that existing code will work with only minor changes and this work can be taken at a later stage. This was a high priority warning message from Microsoft stating the removal, so I urge all of you to be prepared for this removalvery soonand you shouldn’t be surprised.
So where to change…..?
Below are the places where you should change your way of implementation and align with Microsoft…
The Organization Data Service using this end point /XRMServices/2011/OrganizationData.svc in Javascript, you can find it out with the help of the checker service rule web-avoid-crm2011-service-odata for identification. This can be code which was making OData calls to perform CRUD Operations on the current table or related table.
Check any other code, including PowerShell scripts, that send requests to this endpoint: /xrmservices/2011/organizationdata.svc.
Cross Check your Power BI reports or Excel Data sources that may be using this endpoint.
Note:
This announcement does not involve the deprecated Organization Service SOAP endpoint, meaning using Organization service in plugins. At this time, no date has been announced for the removal of that endpoint. At the time of writing this blog post, Microsoft didn’t announce whether this removal is only for Online or On Premise Versions.
Have you or some one in your team accidentally deleted some your flows and want them to be back..? Then this post is for you…
There are the two ways you can restore deleted flows up to 20 days in either way…once after 20 days, even Microsoft Support couldn’t recover your flows.
In this blog post, we will see how you can recover your flows using first approach using Power Automate Management connector which is much simpler.
All you need is a button flow with two Power Automate management connector actions—List Flows as Admin and Restore Deleted Flows as Admin.
So let’s see…
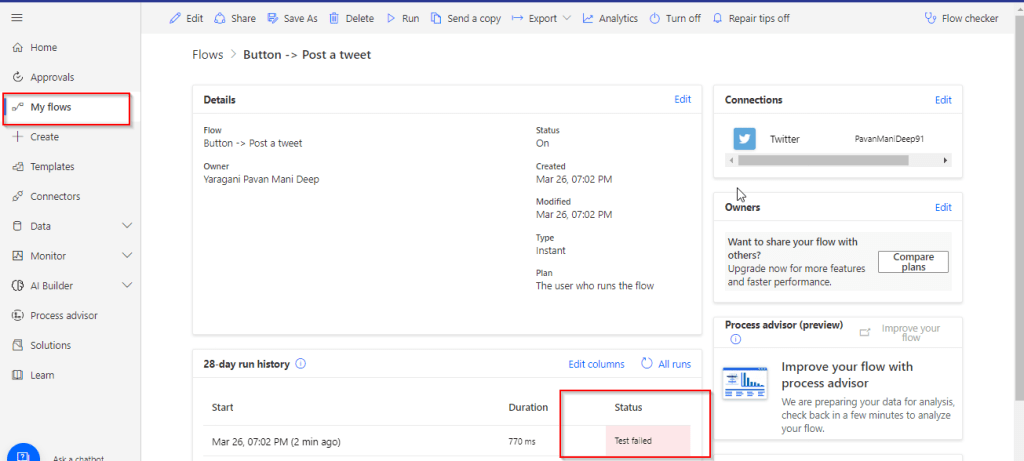
I have a very simple flow as below…
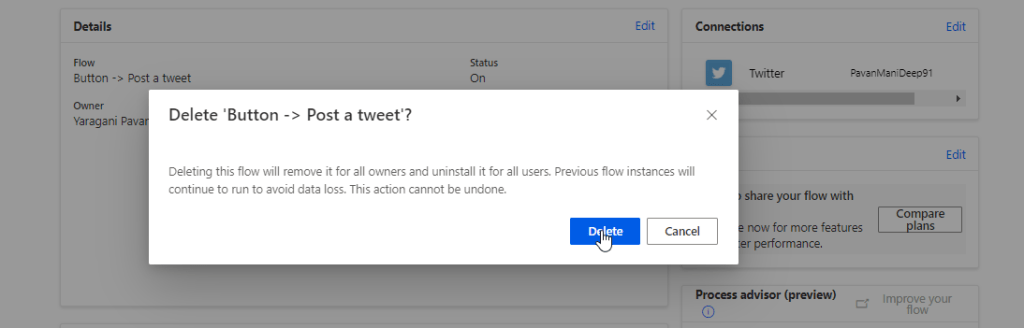
But is has been failing due to some authentication issue, so I have deleted it…
Later I understood the root cause for the authentication issue, I want the flow created to be back. But no problem, you can recover your flow as below…So follow these steps to quickly get your deleted flow back…using an another flow…
Choose a manual trigger…
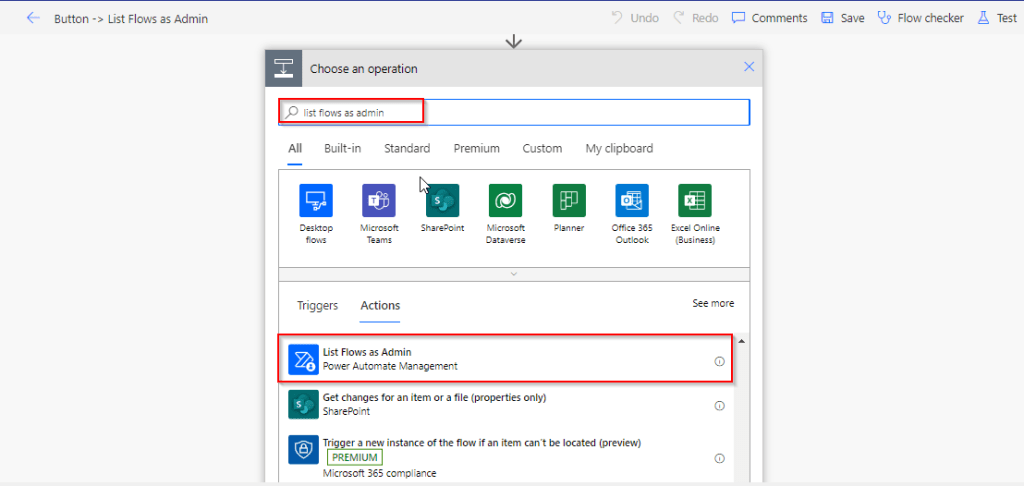
Next add an action, and choose an operation by searching list flows as admin.
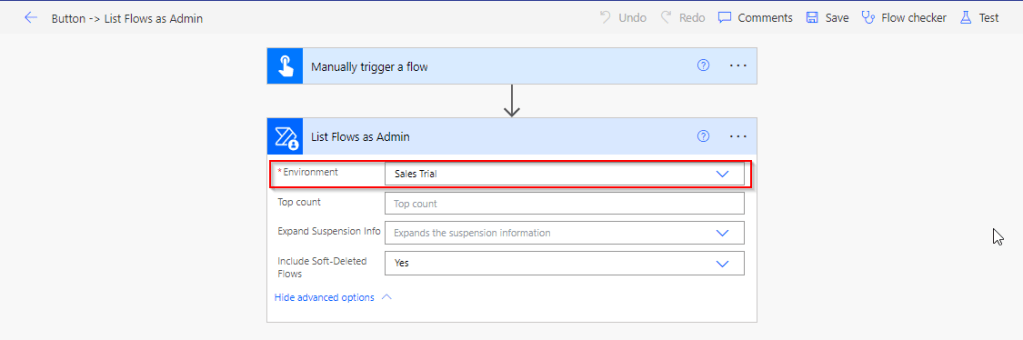
Select your environment in the connector
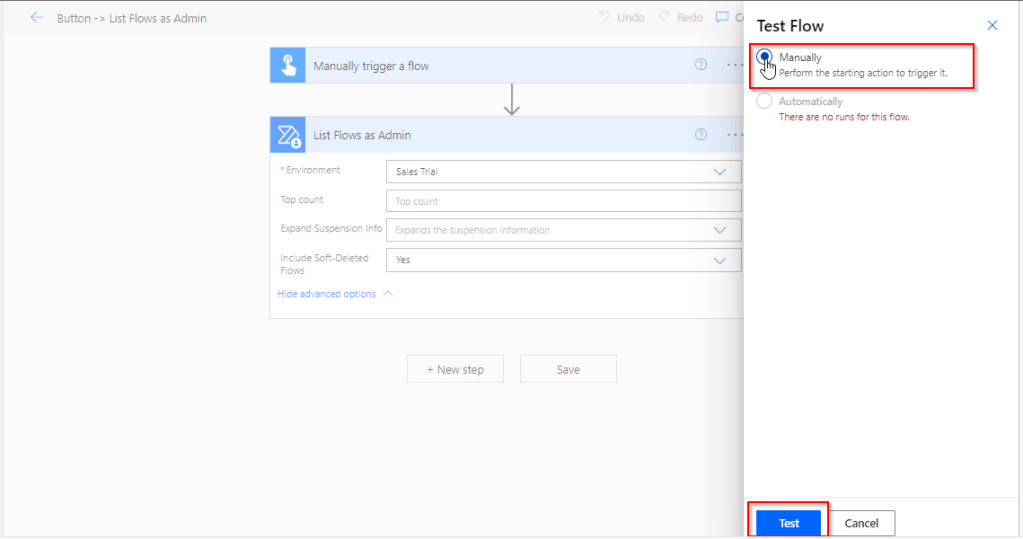
Save your flow and test it…
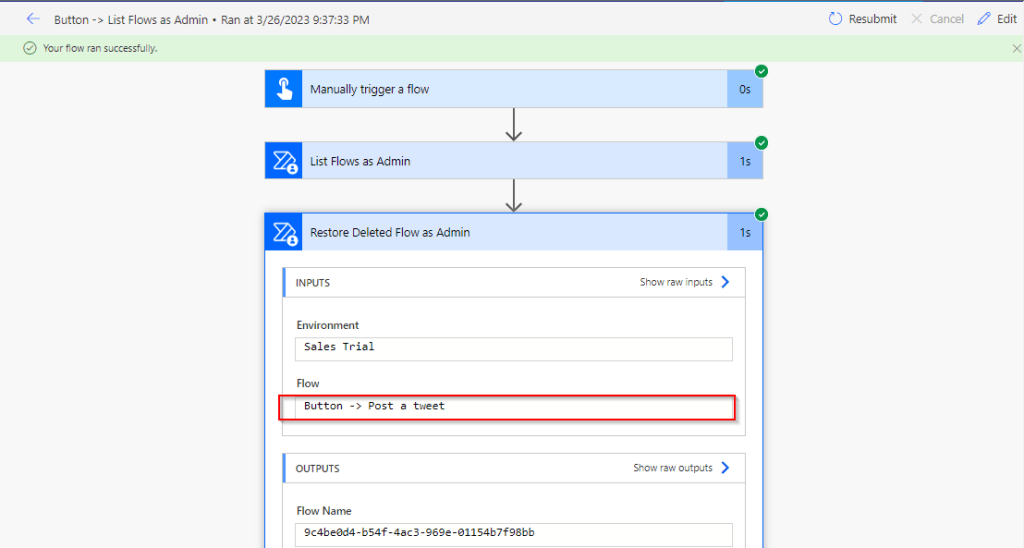
Once your flow is successful, verify the outputs..scroll to find out the flow, check for the display name and note down the name associated.
This connector will list down all the flows created in your tenant…when you expand the raw OUTPUTS/value. Note the name which is nothing but the Guid of your flow.
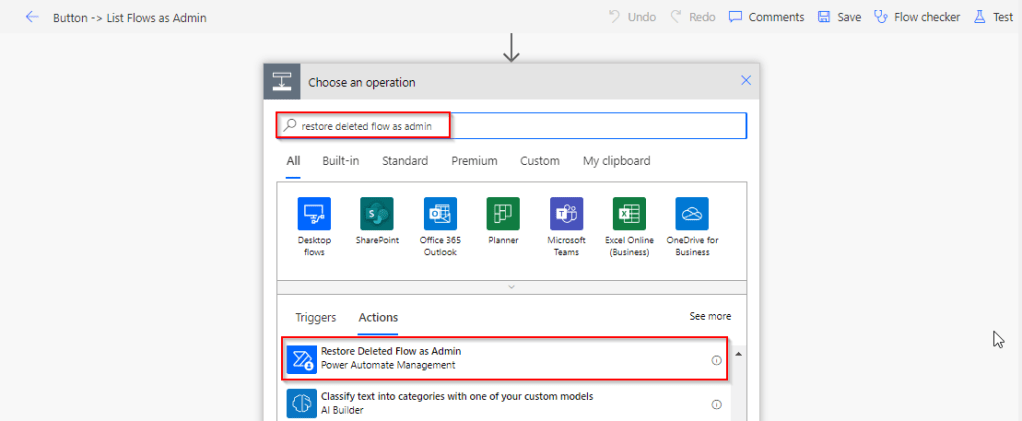
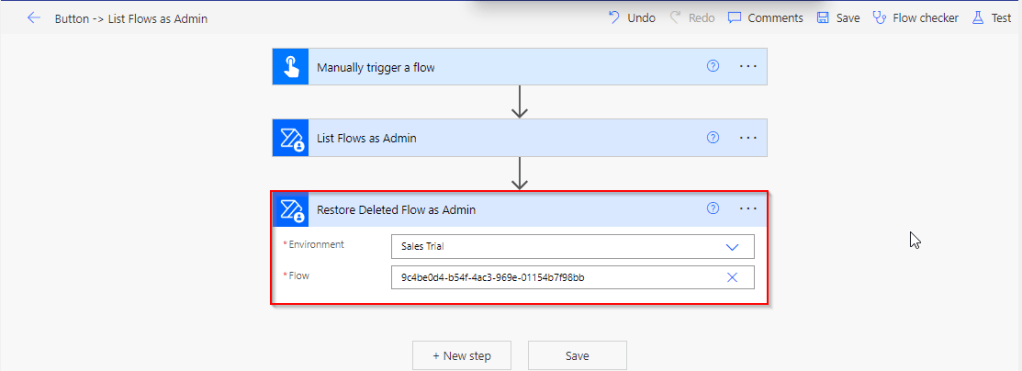
Add Restore Deleted Flows as Admin action and run the flow by searching for the same as below.
Add the Restore Deleted Flows as Admin action from the Power Automate Management Connector.
In the Flow field, enter the name value ie. Guid noted from previous step ie.
9c4be0d4-b54f-4ac3-969e-01154b7f98bb
Save the flow, and test/run it.
You can note your flow is back, you can find out under My Flows but it’s disabled state.
Note:
The steps in this article apply to both non-solution and solution flows.
Flows that were deleted more than 20 days ago can’t be recovered. Both restore methods (PowerShell script and Power Automate Management connector), as well as Microsoft Support can’t help to restore them.
After you restore a flow, it defaults to the disabled state. You must manually enable the flow, per your requirements.
This blog post is all about performance considerations for your Power Platform CE Projects and how you can plan to optimize application performance for your Power Apps. So I just want to take you through them…
Are you tired of creating solutions for longer durations and while at the end of the project or during UAT you end up facing performance issues for the solutions you have developed, one of the most important non-functional requirements for a project’s success is Performance. Satisfying performance requirements for your users can be a challenge. Poor performance may cause failures in user adoption of the system and lead to project failure, so you might need to be careful for every decision you take while you design your solutions in the below stages.
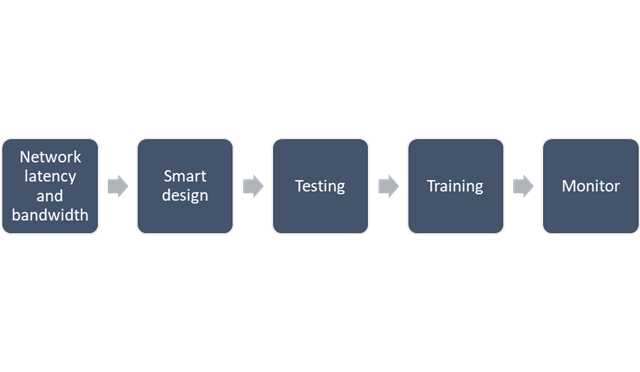
Let’s talk about them one by one..
1. Network Latency and bandwidth
A main cause of poor performance of Dynamics 365 apps is the latency of the network over which the clients connect to the organization.
Bandwidth is the width or capacity of a specific communications channel.
Latency is the time required for a signal to travel from one point on a network to another and is a fixed cost between two points. And usually many of these “signals” travel for a single request.
Lower latencies (measured in milliseconds) generally provide better levels of performance. Even if the latency of a network connection is low, bandwidth can become a performance degradation factor if there are many resources sharing the network connection, for example, to download large files or send and receive email.
Dynamics 365 apps are designed to work best over networks that have the following elements:
Bandwidth greater than 50 KBps (400 kbps)
Latency under 150 ms
These values are recommendations and don’t guarantee satisfactory performance. The recommended values are based on systems using out-of-the box forms that aren’t customized.
If you significantly customize the out-of-box forms, it is recommend that you test the form response to understand bandwidth needs.
You can use the diagnostics tool to determine the latency and bandwidth:
On your computer or device, start a web browser, and sign in to an organization.
Also, to mitigate higher natural latency for global rollouts, customers should leverage Dynamics 365 Apps successfully by having smart design for their applications.
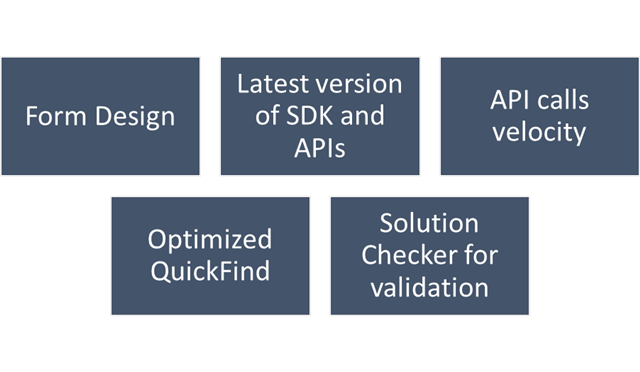
2.Smart Design for your application
Form design
Keep the number of fields to a minimum. The more fields you have in a form, the more data that needs to be transferred over the internet or intranet to view each record. Think about the interaction the user will have with the form and the amount of data that must be displayed within it.
Avoid including unnecessary JavaScript web resource libraries. The more scripts you add to the form, the more time it will take to download them. Usually, scripts are cached in your browser after they are loaded the first time, but the performance the first time a form is viewed often creates a significant impression.
Avoid loading all scripts in the Onload event. If you have code that only supports OnChange events for fields or the OnSave event, make sure to set the script library with the event handler for those events instead of the OnLoad event. This way loading those libraries can be deferred and increase performance when the form loads.
Use tab events to defer loading web resources. Any code that is required to support web resources or IFRAMEs within collapsed tabs can use event handlers for the TabStateChange event and reduce code that might otherwise have to occur in the OnLoad event.
Set default visibility options. Avoid using form scripts in the OnLoad event that hide form elements. Instead set the default visibility options for form elements that might be hidden to not be visible by default when the form loads. Then, use scripts in the OnLoad event to show those form elements you want to display. If the form elements are never made visible, they should be removed from the form rather than hidden.
Avoid opening a new tab or window and do open the window in the main form dialog.
For Command Bar, keep the number of controls to a minimum. Within the command bar or the ribbon for the form, evaluate what controls are necessary and hide any that you don’t need. Every control that is displayed increases resources that need to be downloaded to the browser. Use asynchronous network requests in Custom Rules When using custom rules that make network requests in Unified Interface, use asynchronous rule evaluation.
Only the columns required for information or action should be included in API calls:
Retrieving all columns (*) creates significant overhead on the database engine when distributed across significant user load. Optimization of call velocity is key to avoid “chatty” forms that unnecessarily make repeated calls for the same information in a single interaction.
You should avoid retrieving all columns in a query result because of the impact on a subsequent update of records. In an update, this will set all field values, even if they are unchanged, and often triggers cascaded updates to child records. Leverage the most efficient connection mechanism (WebAPI vs SDK) and reference this doc site for guidance on the appropriate approach.
You should continue to use the ITracingService.Trace to write to the Plug-in Trace Log table when needed. If your plug-in code uses the ILogger interface and the organization does not have Application Insights integration enabled, nothing will be written. So, it is important to continue to use the ITracingService Trace method in your plug-ins. Plug-in trace logs continue to be an important way to capture data while developing and debugging plug-ins, but they were never intended to provide telemetry data.
For organizations using Application Insights, you should use ILogger because it will allow for telemetry about what happens within a plug-in to be integrated with the larger scope of data captured with the Application Insights integration. The Application Insights integration will tell you when a plug-in executes, how long it takes to run and whether it makes any external http requests. Learn more about tracing in plugins Logging and tracing (Microsoft Dataverse) – Power Apps | Microsoft Learn.
Use Solution Checker to analyze solution components
Best practice is to run Solution Checker for all application code and include it as mandatory step while you design solutions or check when you complete developing your custom logic.
Quick Find
For an optimal search experience for your users consider the next:
All columns you expect to return results in a quick find search need to be included in the view or your results will not load as expected.
It is recommended to not use option sets in quick find columns. Try using the view filtering for these.
Minimize the number of fields used and avoid using composite fields as searchable columns. E.g., use first and last name as searchable vs full name.
Avoid using multiple lines of text fields as search or find columns.
Evaluate Dataverse search vs using leading wildcard search
3. Training
This step should be done during user training or during UAT. To ensure optimal performance of Dynamics 365, ensure that users are properly leveraging browser caching. Without caching, users can experience cold loads which have lower performance than partially (or fully) warm loads.
Train users to not clear the browser cache manually.
Check if devices have enough space allocated for browser cache.
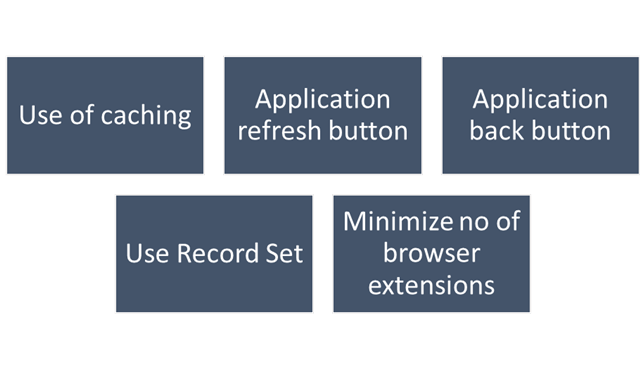
Make sure to train users to:
Use application inline refresh over browser refresh (should not use F5)
Use application inline back button instead browser’s back button.
Avoid InPrivate/Incognito modes in browser which causes cold loads.
Make users aware that running applications which consumes lot of bandwidth (like video streaming) may affect performance.
Do not install browser extensions unless they are necessary (this might be also blocked via policy)
Do use ‘Record Set’ to navigate records quickly without switching from form back to the list.
4. Testing
For business processes where performance is critical or processes having complex customizations with very high volumes, it is strongly recommended to plan for performance testing. Consider reviewing the below technical talk series describing important performance considerations, as well as sharing practical examples of how to set up and execute performance testing, and analyze and mitigate performance issues. Reference: Performance Testing in Microsoft Dynamics 365 TechTalk Series – Microsoft Dynamics Blog
5. Monitoring
You should define a monitoring strategy and might consider using any of the below tools based on your convenience.
Monitor Dynamic 365 connectivity from remote locations continuously using network monitoring tools like Azure Network Performance Monitor or 3rd party tools. These tools help identify any network related problems proactively and drastically reduce troubleshooting time of any potential issue.
Application Insights, a feature of Azure Monitor, is widely used within the enterprise landscape formonitoring and diagnostics. Data that has already been collected from a specific tenant or environment is pushed to your own Application Insights environment. The data is stored in Azure Monitor logs by Application Insights, and visualized in Performance and Failures panels under Investigate on the left pane. The data is exported to your Application Insights environment in the standard schema defined by Application Insights. The support, developer, and admin personas can use this feature to triage and resolve Telemetry events for Microsoft Dataverse – Power Platform | Microsoft Learn
Dataverse and PowerApps analytics in the Power Platform Admin Centre. Through the Plug-in dashboard in the Power Platform Admin Center you can view metrics such as average execution time, failures, most active plug-ins, and more.
Dynamics 365 apps include a basic diagnostic tool that analyzes the client-to-organization connectivity and produces a report.
Monitor is a tool that offers makers the ability to view a stream of events from a user’s session to diagnose and troubleshoot problems. Works both for model driven apps and canvas apps.
I hope this blog post had helped you learn or know something new…thank you for reading…